Deep Dive
Research
Hyperliquid


A tick-level analysis of onchain price discovery during the largest oil supply disruption in modern history.
Global oil markets have weathered every geopolitical crisis of the past fifty years with the same infrastructure: centralized exchanges, weekday trading hours, weekend closures. This infrastructure assumes major events happen during trading hours.
On February 28, 2026, the United States and Israel launched aerial strikes against Iran. It was a Saturday. Every commodities exchange in the world was closed.
The only liquid venue where crude oil could be traded was Hyperliquid, a blockchain-native perpetual futures exchange running 24/7. Bloomberg relied on Hyperliquid for oil price action throughout the weekend. DL News, CoinDesk, and other major outlets reported the same story: a decentralized exchange had become the sole global price discovery venue for one of the most important commodities on Earth.
We tracked every trade across two consecutive weekends on Hyperliquid's HIP-3 oil markets using tick-level fills data, CME reference prices, and microstructure analysis. Onchain markets for RWAs such as commodities and equities are the next billion-dollar opportunity in finance and the data from the first two weekends of the Iran conflict shows why.

The 49-Hour Vacuum
On Friday, February 27, 2026 at 22:00 UTC, the CME closed for its regular weekend maintenance. The last minute of WTI crude futures settled at $67.02.
Every major oil futures exchange in the world follows roughly the same weekly schedule: open Sunday evening, close Friday afternoon. The specific hours differ slightly by exchange, but the results are identical. From Friday evening to Sunday evening, the global oil futures market goes dark.
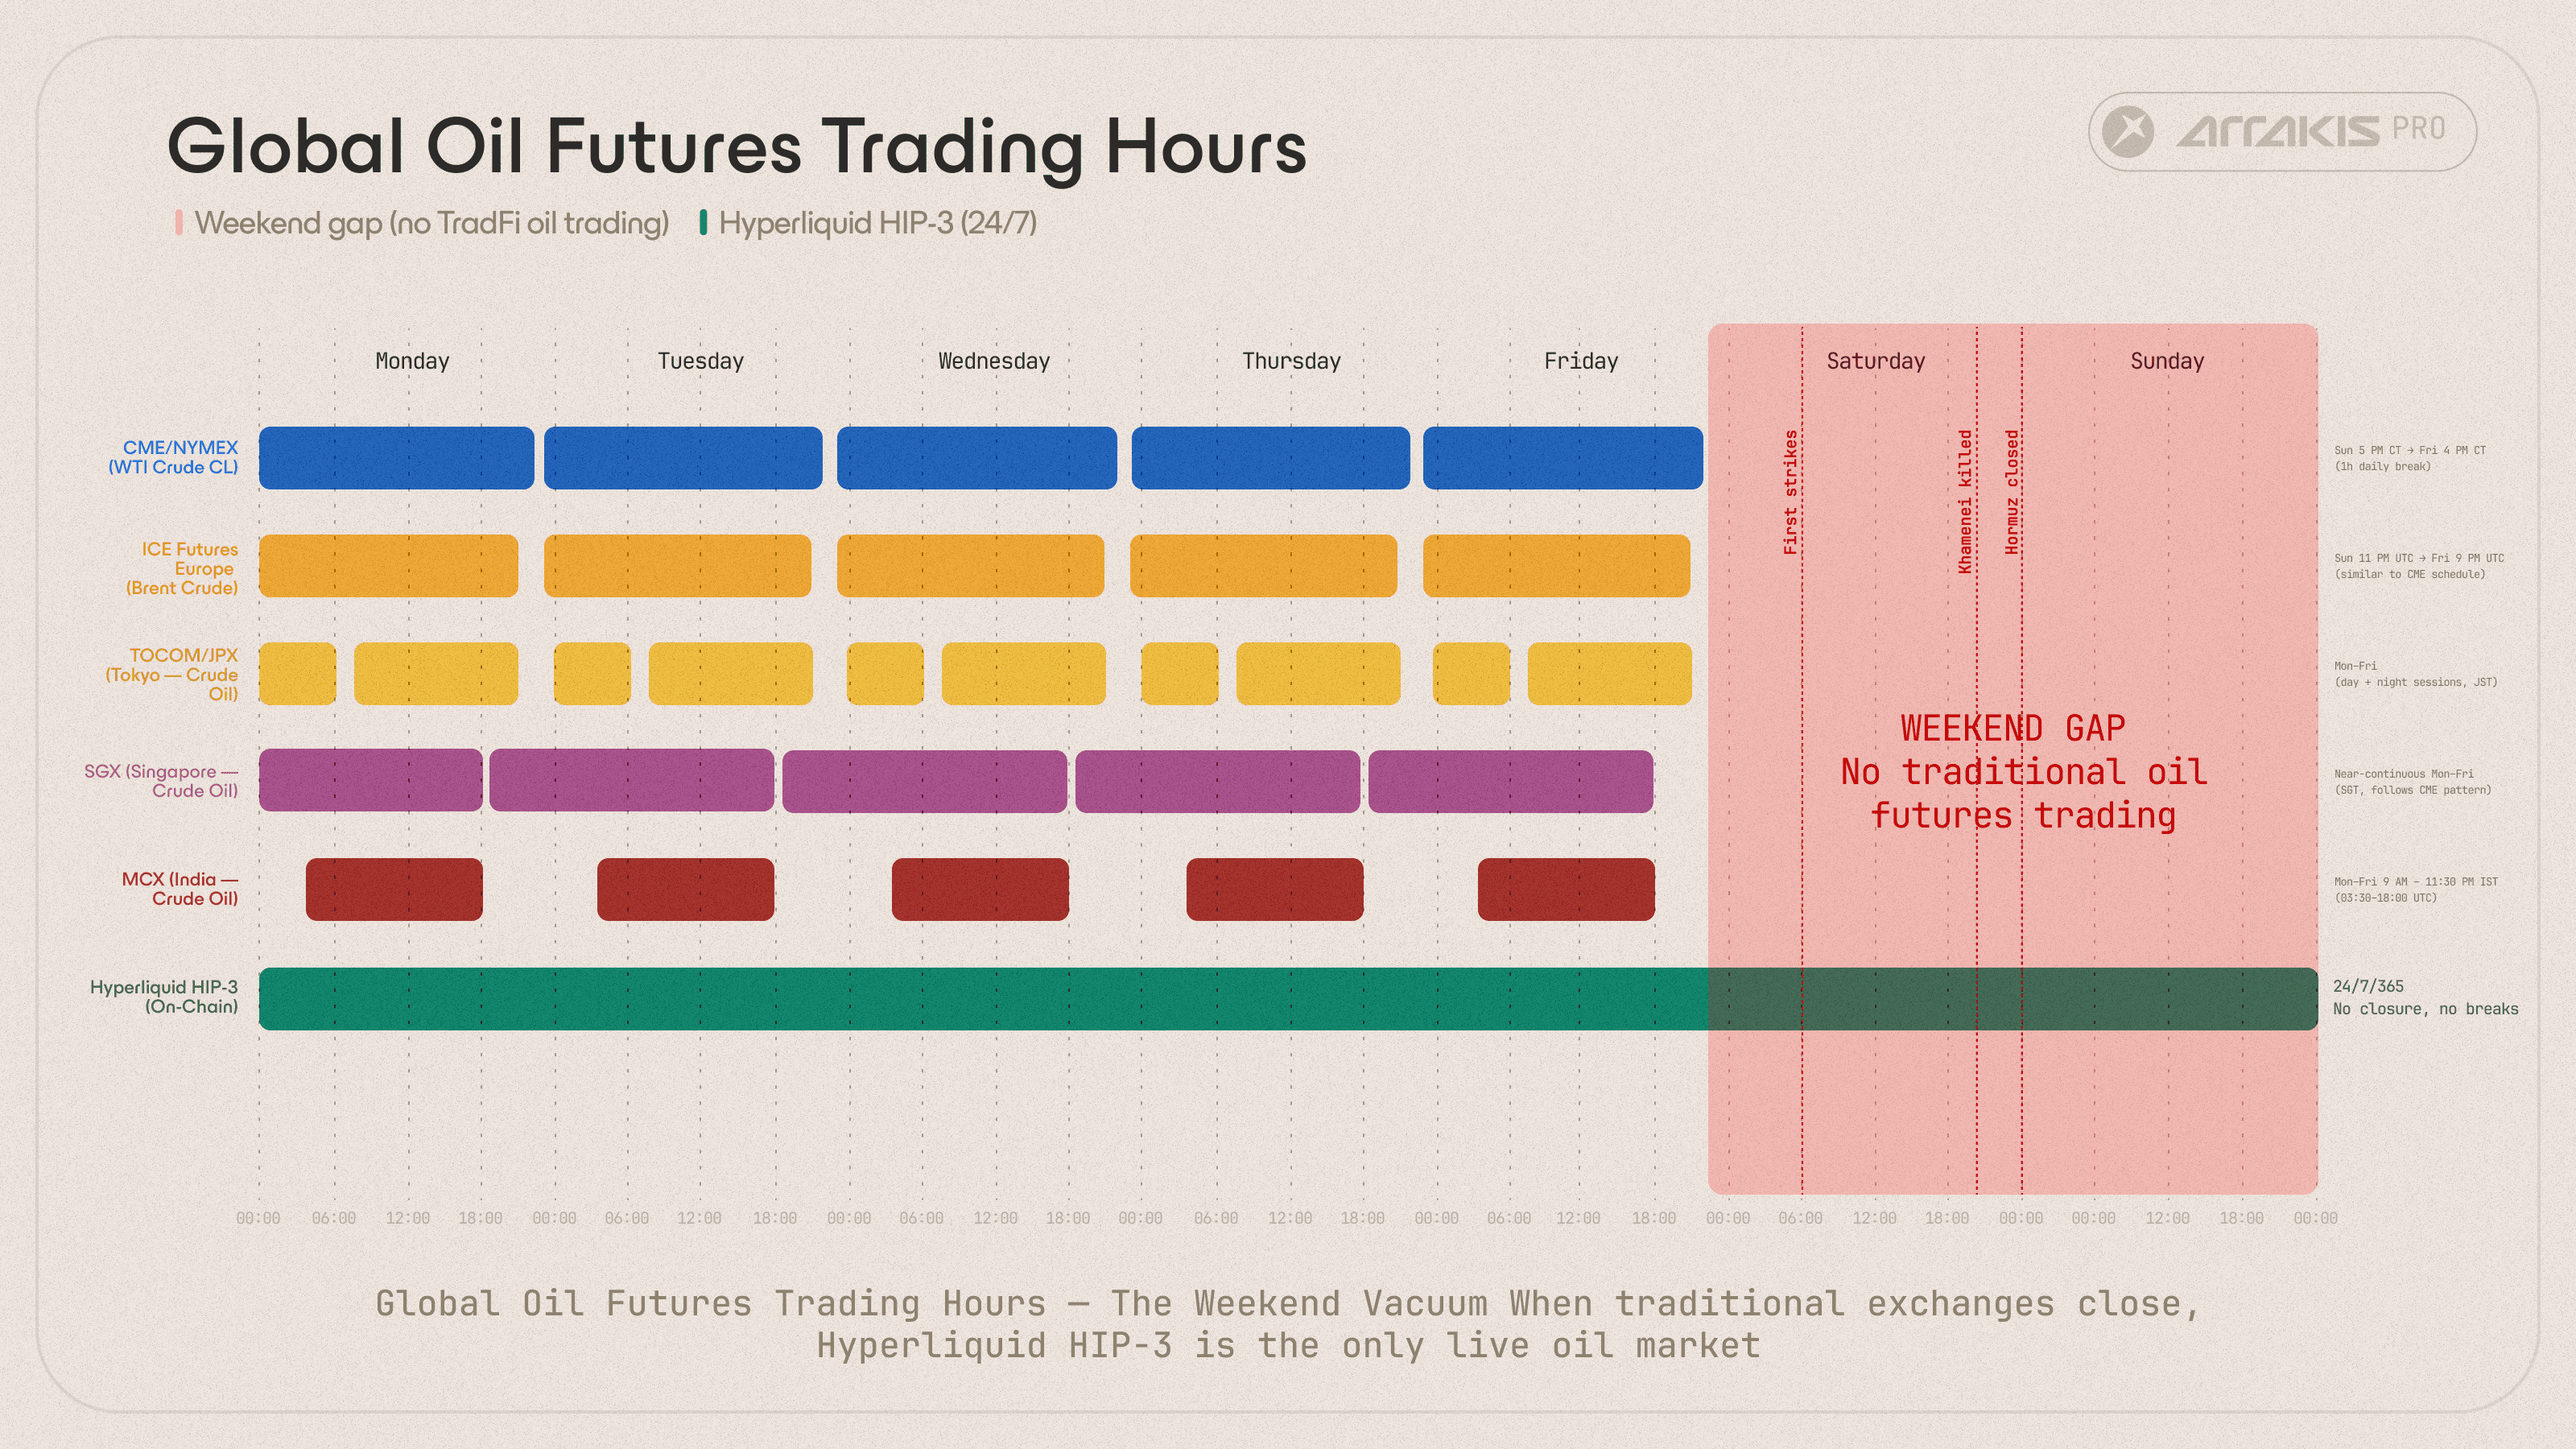
During the Feb 28th crisis, all three events (first strikes, Khamenei killed, Hormuz closure) hit inside the red gap. Hyperliquid was the only live oil market.
This is normally fine as weekends are usually quiet but on February 28, 2026, they weren’t.
By 07:30, Trump had confirmed Operation Epic Fury on TruthSocial.
By 20:18, Ayatollah Khamenei was confirmed dead.
By 23:58, Iran had declared the Strait of Hormuz closed to all shipping.
Each of these events individually, would have moved oil prices significantly. Together, they produced the largest oil supply disruption in recorded history, nearly three times the scale of the 1973 Arab embargo, according to Rapidan Energy Group, with roughly 20% of global supply knocked offline.
Hyperliquid runs 24/7/365. Its HIP-3 perpetual contracts, xyz:CL (Trade.xyz), km:USOIL (Kinetiq), and flx:OIL (Felix), kept trading through every second of that weekend. During the 49-hour CME closure window, these markets processed 27,617 trades across 1,685 unique wallets, representing over $25.3M in notional volume.
Over the following two weekends, as the conflict escalated, these numbers grew by an order of magnitude:
Weekend 1 | Weekend 2 | Weekend 3 | |
|---|---|---|---|
Total Trades | 27,617 | 302,917 | 394,854 |
Unique Wallets | 1,685 | 6,794 | 7,981 |
Notional Volume | $25.3M | $332M | $550M |
How Fast Did Markets React?
At 06:14 UTC on February 28, the first strikes hit Iranian targets. Tick-level data, sampled at one-second granularity, reveals the exact reaction sequence across Hyperliquid's oil markets.
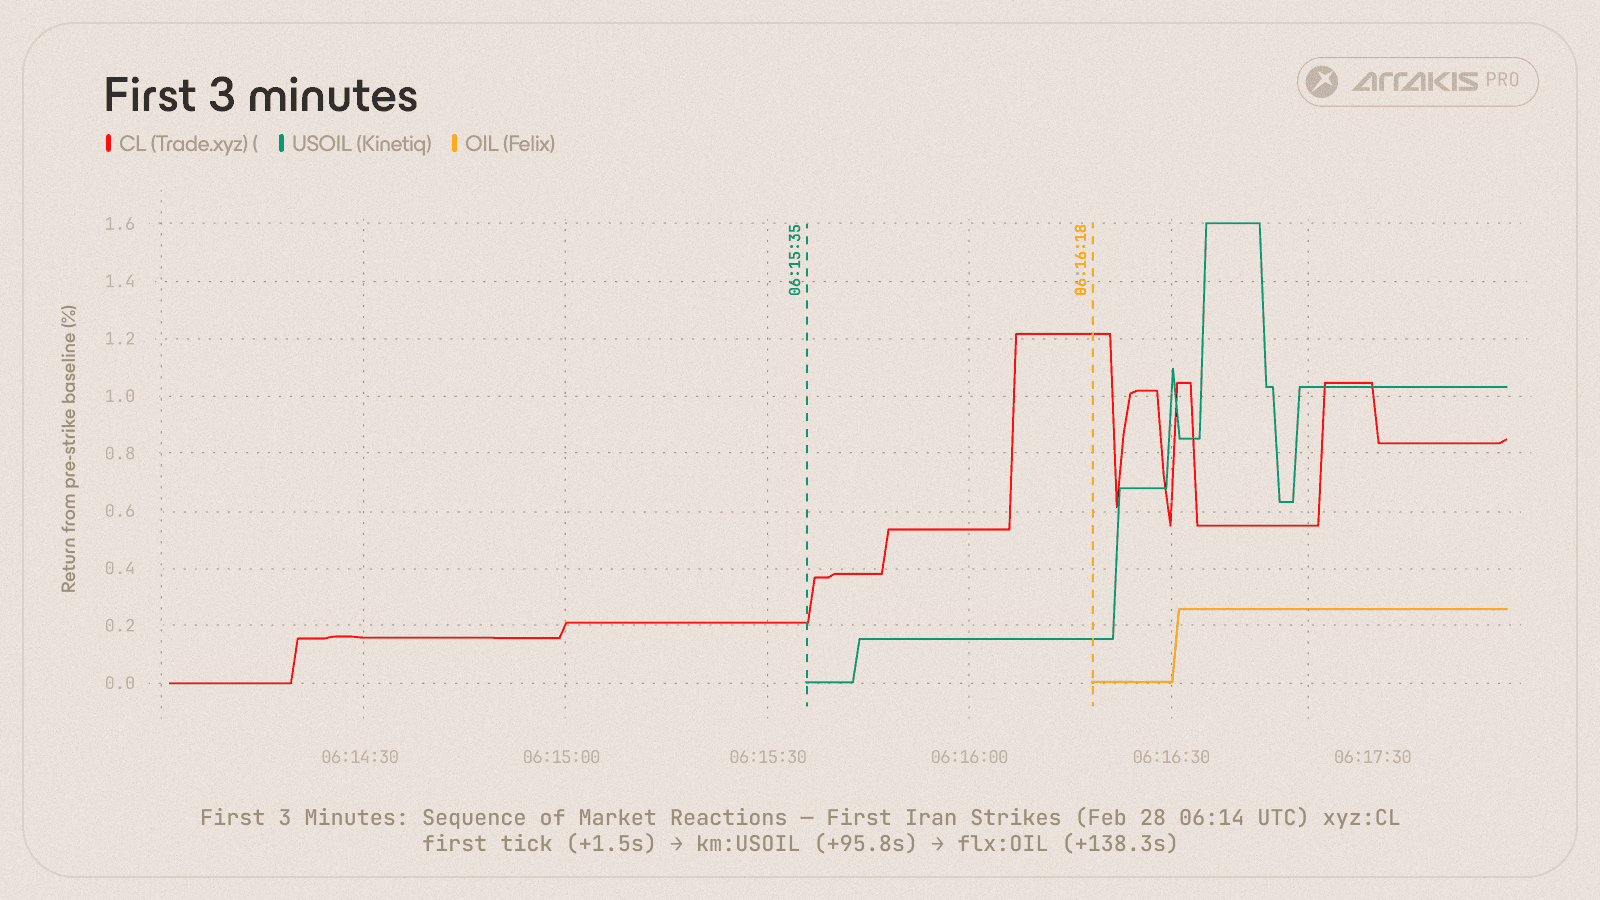
Fill data tracked 3 minutes after the Iran strikes (06:14 UTC, Feb 28). xyz:CL reacts in 1.5 seconds; km:USOIL follows at +95.8s; flx:OIL at +138.3s.
Market | First Significant Trade | Delay from T0 |
|---|---|---|
xyz:CL (Trade.xyz) | 06:14:01.5 UTC | +1.5 seconds |
km:USOIL (Kinetiq) | 06:15:35.8 UTC | +95.8 seconds |
flx:OIL (Felix) | 06:16:18.3 UTC | +138.3 seconds |
Matteo's analysis of HIP-3's role as a weekend price discovery venue reached similar conclusions on reaction timing.
The gap between the fastest and slowest HIP-3 market was over two minutes. The gap between the fastest and slowest HIP-3 market was over two minutes. Each market was discovering price independently, driven by its own liquidity and participant base, while the entire traditional oil futures complex was offline.
Weekend 1: Price Discovery in Action
When the CME reopened at 23:00 UTC on March 1 (first tick at 23:10 UTC), WTI opened at $71.86, a +7.22% gap from the Friday close. At that moment, xyz:CL was already trading at a cumulative return of +5.13% from the pre-close baseline. The onchain market had priced in roughly 78% of the move before the CME opened.
That figure is instructive. Part of it reflects price discovery by informed participants trading around the clock. Part of it reflects a ceiling: protocol constraints set by each deployer that prevented these markets from going higher.
Discovery Bounds
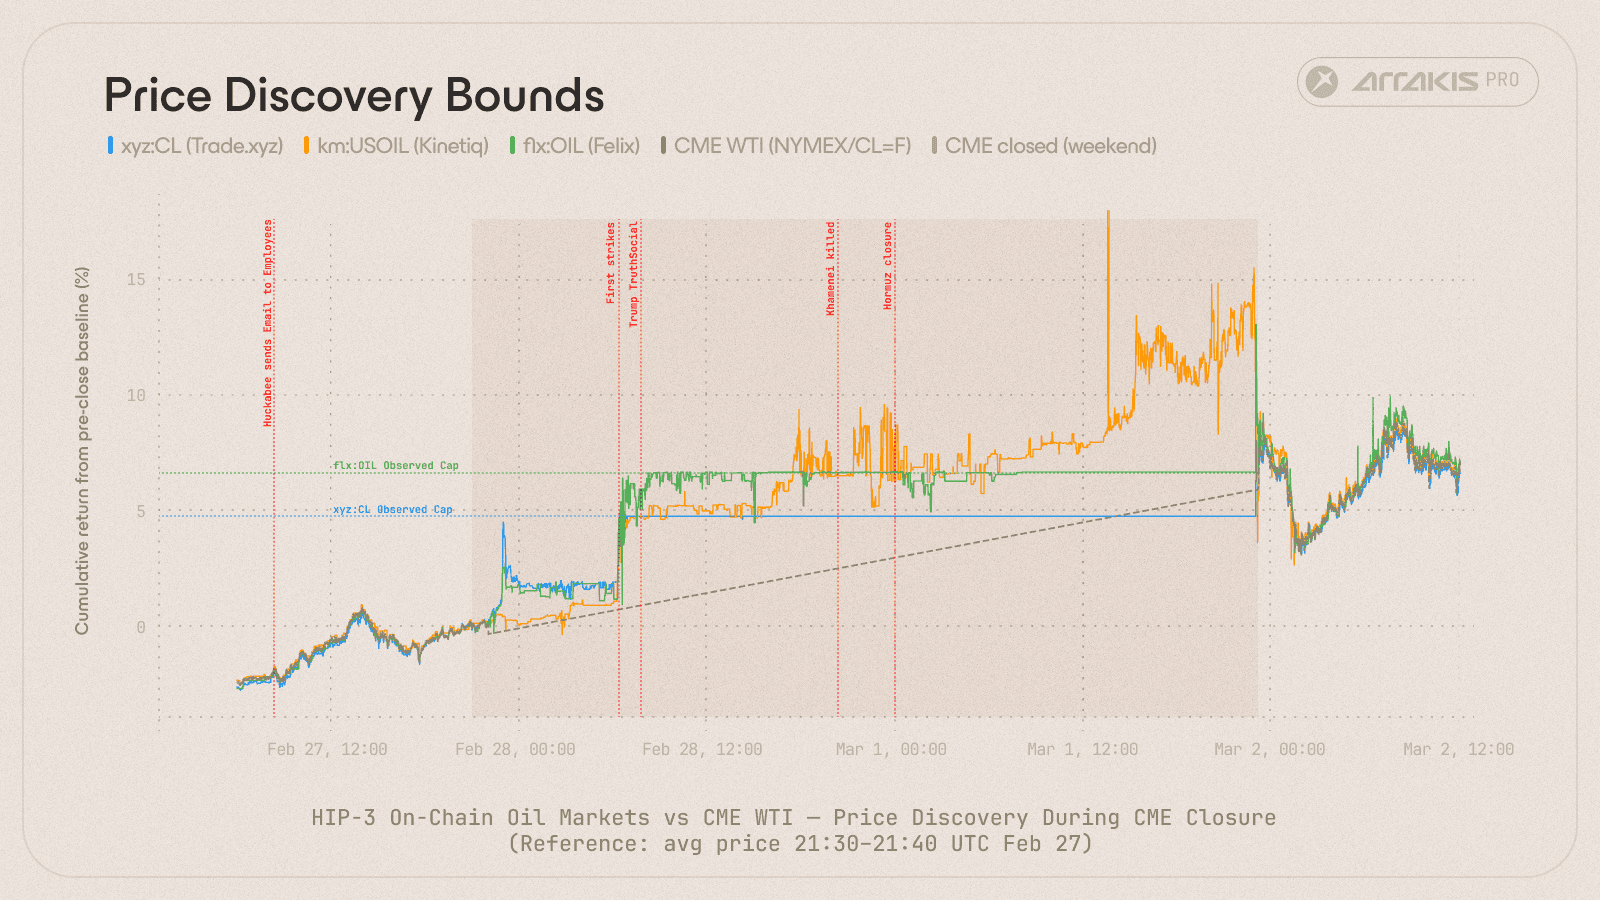
Discovery bounds capped price movement during the CME closure. xyz:CL and flx:OIL hit their protocol-level ceilings at +4.7% and +6.6% from CME from baseline respectively, holding both markets below fair value when CME reopened at +7.2%. km:USOIL was the only HIP-3 market without discovery bounds which traded freely but overshot at +14.3% before CME reopened.
Each HIP-3 oil market was built by an independent team that made different decisions on oracle handling, leverage limits, and funding mechanisms. Those decisions determined thow much of the real price move their market could express.
Protocol | Market | Max Leverage | Theoretical Bound | Observed Cap (W1) | Constraint Type |
Trade.xyz | xyz:CL | 20x | ±5% | +5.4% (flatlined 40hrs) | Discovery bound: mark price cannot deviate from last external oracle price by more than 1/max leverage |
Felix | flx:OIL | 12x | ±8.33% | +7.1% | Funding rate cap (±4% annualized off-hours) binds before the discovery bound |
Kinetiq | km:USOIL | - | None | +18.01% (peak), corrected at CME open | No protocol-level bounds |
Note: The charts use the 10-minute pre-close average as baseline. Text percentages reference the Friday close tick. Both are correct but produce different figures for the same absolute price levels.
The binding constraint for Trade.xyz and Felix was the “Discovery Bound” on mark and internal oracle prices. For both Trade.xyz and Felix the mark and internal oracle price cannot deviate from the last externally derived oracle price by more than 1/max leverage Sunday at the CME market closure, capping mark price movement at ±5% (1/max leverage) and ±8.33% respectively. Furthermore, Felix's funding rate cap (±4% annualized during off-hours) binds even tighter than its theoretical discovery bound.
The result: xyz:CL flatlined at $70.654 for 40 consecutive hours. flx:OIL capped at $71.77. Both markets wanted to go higher. The protocols would not allow it. The "78% priced in" stat was, in part, because 78% was all the protocol allowed.
Kinetiq had no such constraints, peaking at +18.01% before the CME reopened at +7.22%. The unconstrained market overshot by roughly 2.5x the actual move, then self-corrected to within 0.28% by reopen. Freedom without constraint produced a different bottleneck: overshoot rather than suppression.
These caps prevent mark price manipulation and protect liquidation engines during periods without a live oracle. But during a crisis that required real-time price discovery, they prevented HIP-3 markets from fully expressing what participants knew.
Convergence at Reopen
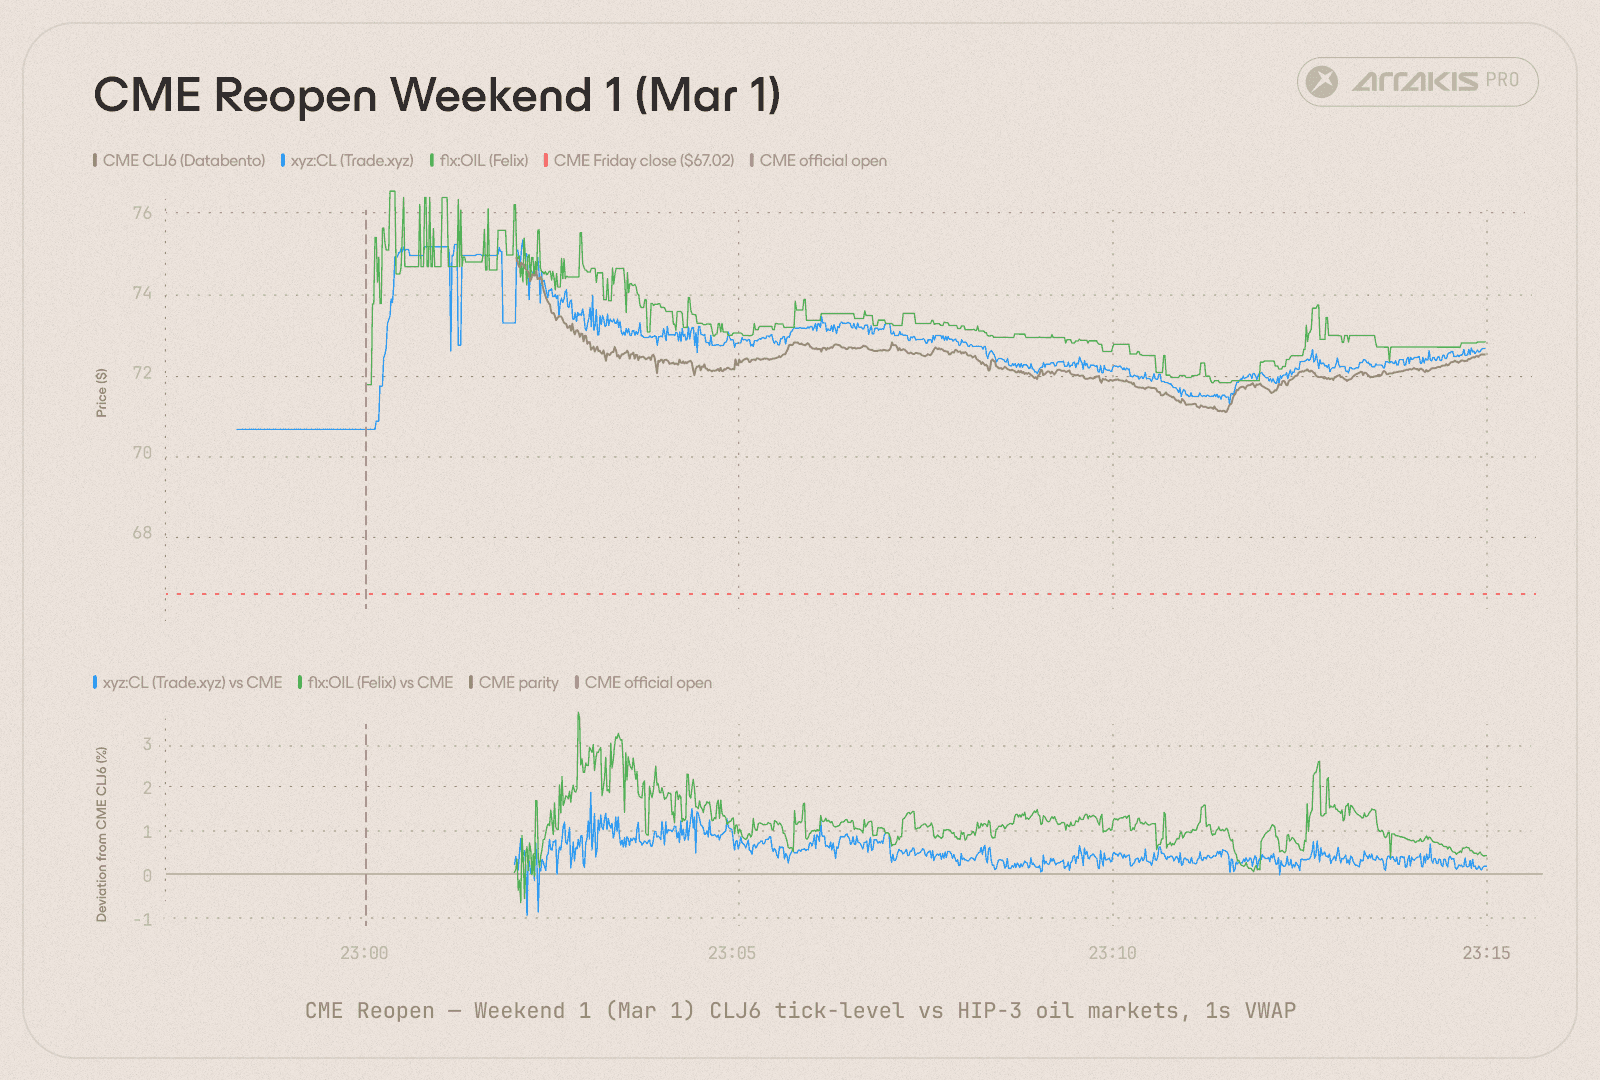
Tick-level fills in the 15 minutes after the CME reopens (Mar 1, 23:00 UTC). xyz:CL snaps to the CME parity almost immediately; flx:OIL converges soon thereafter but follows a higher deviation than xyz:CL. Note: km:USOIL tracks USO on NYSE Arca, not CME WTI directly, which is why we don’t track its convergence in this analysis.
When the CME's first CLJ6 reference price arrived at 23:02 UTC, the gap collapsed. By the first second of paired data, xyz:CL was within 0.24% of the CME.
Market | 10-min Mean Absolute Deviation from CME |
xyz:CL (Trade.xyz) | 0.60% |
flx:OIL (Felix) | 1.29% |
We paired tick-level CME data (Databento, CLJ6) against Hyperliquid fills at 1-second resolution. xyz:CL's 0.60% deviation indicates well-capitalized market makers closing the basis in real time. flx:OIL's 1.29% deviation reflects thinner books and a different participant base.
Period | Trades/Hour | vs. Baseline |
Pre-crisis baseline | ~47 | - |
During CME closure | 994 | 21x |
At CME reopen (arb rush) | 1,244 | 26x |
The demand to trade oil did not wait for the CME. Once it reopened, automated arbitrage bots monitoring CLJ6 tick data closed the onchain/off-chain basis within seconds.
Cross-Market Fragmentation
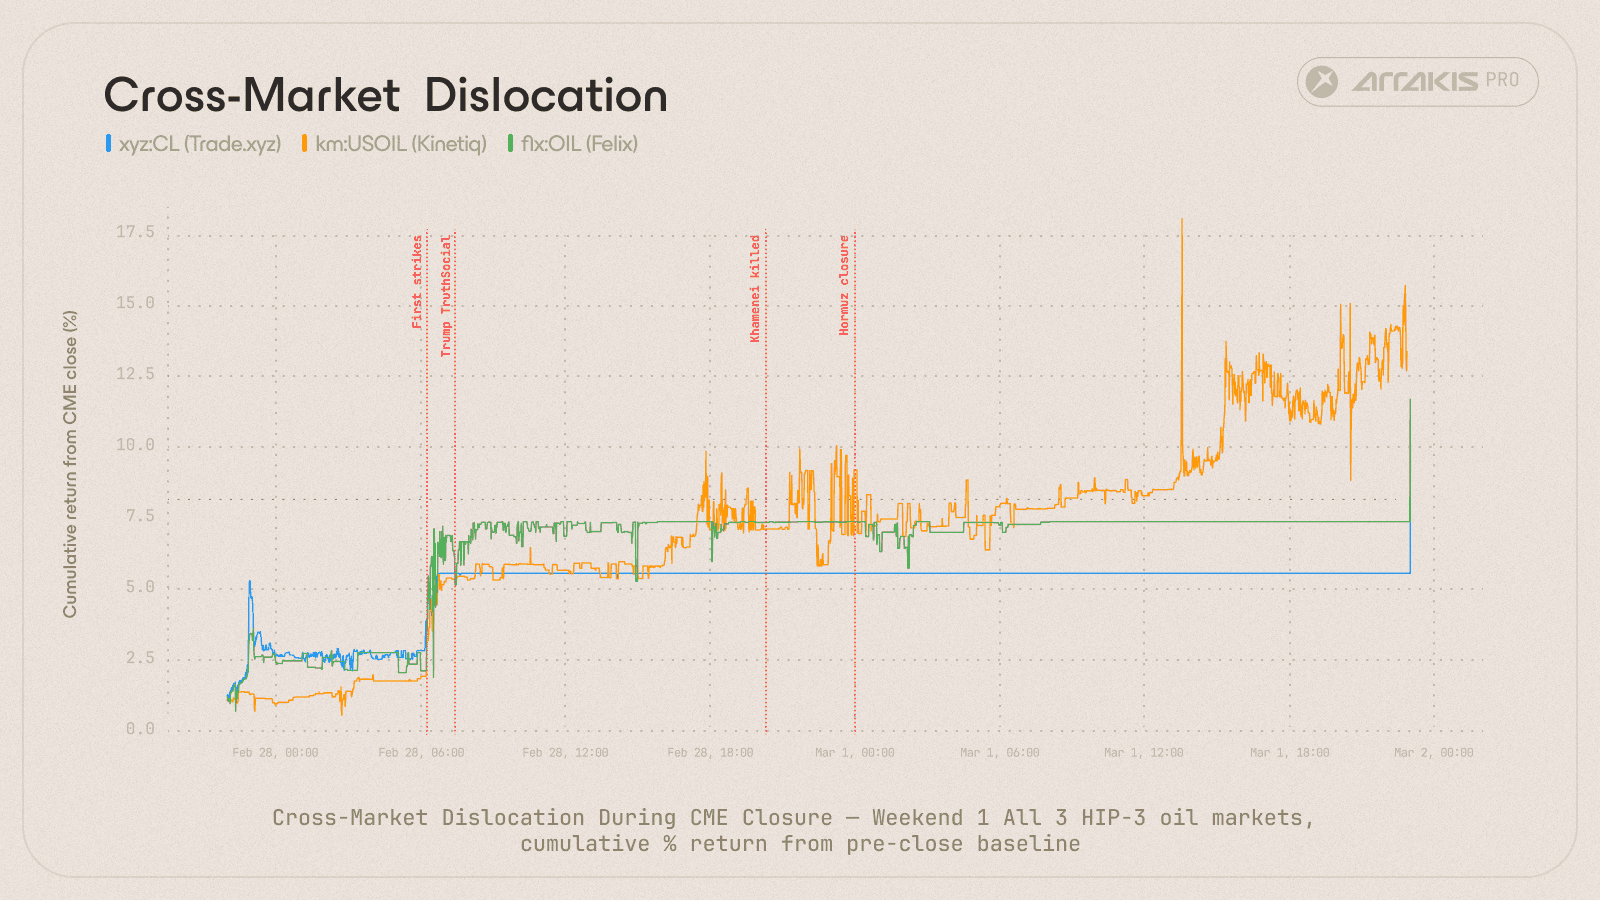
Cumulative returns across all three HIP-3 oil markets during the 49-hour CME closure (Feb 27 22:00 - Mar 1 23:00 UTC). Returns are indexed to each market's average price 10 minutes before CME closed. Large dislocations persisted between all three markets throughout the weekend, indicating structural bottlenecks in onchain oil market infrastructure.
All three markets moved directionally correct (long oil, prices up), but they traded at widely different prices throughout the weekend. Spreads between xyz:CL, flx:OIL, and km:USOIL widened and narrowed unpredictably. Each contract's price was a function of its own liquidity, participant base, and deployer mechanics. The dislocation maps the current frontier: directionally accurate, fragmented, bounded by the design decisions each team made when they built their market.
Weekend 2: The Larger Test
The following weekend, the CME closed again on schedule and the market defaulted to Hyperliquid's HIP-3 contracts for price discovery. This time, the conviction was overwhelming.
Weekend 1 (Feb 27 - Mar 2) | Weekend 2 (Mar 6 - Mar 9) | Change | |
|---|---|---|---|
Total trades | 91,179 | 547,523 | 6x |
Unique wallets | 3,761 | 10,008 | 2.7x |
Notional volume | $145M+ | $964M | 6.6x |
In a single week, Hyperliquid's oil markets grew by 6.6 times in volume. Almost a billion dollars in notional traded during the second weekend alone, across 10,000 unique wallets.
On Friday, March 6 at 22:00 UTC, the CME closed with WTI at $90.90, already up 35% from pre-crisis levels. Over the next 48 hours, three more events hit:
Kuwait Force Majeure (13:51 UTC, Mar 7), KPC declared force majeure on oil exports as Hormuz transit slowed to a trickle.
Israel strikes Iranian fuel depots (20:45 UTC, Mar 7), direct hits on Tehran and Karaj oil storage and transfer facilities.
New Supreme Leader named (18:07 UTC, Mar 8), Mojtaba Khamenei was named by the Assembly of Experts, signaling continuity of the conflict rather than de-escalation.
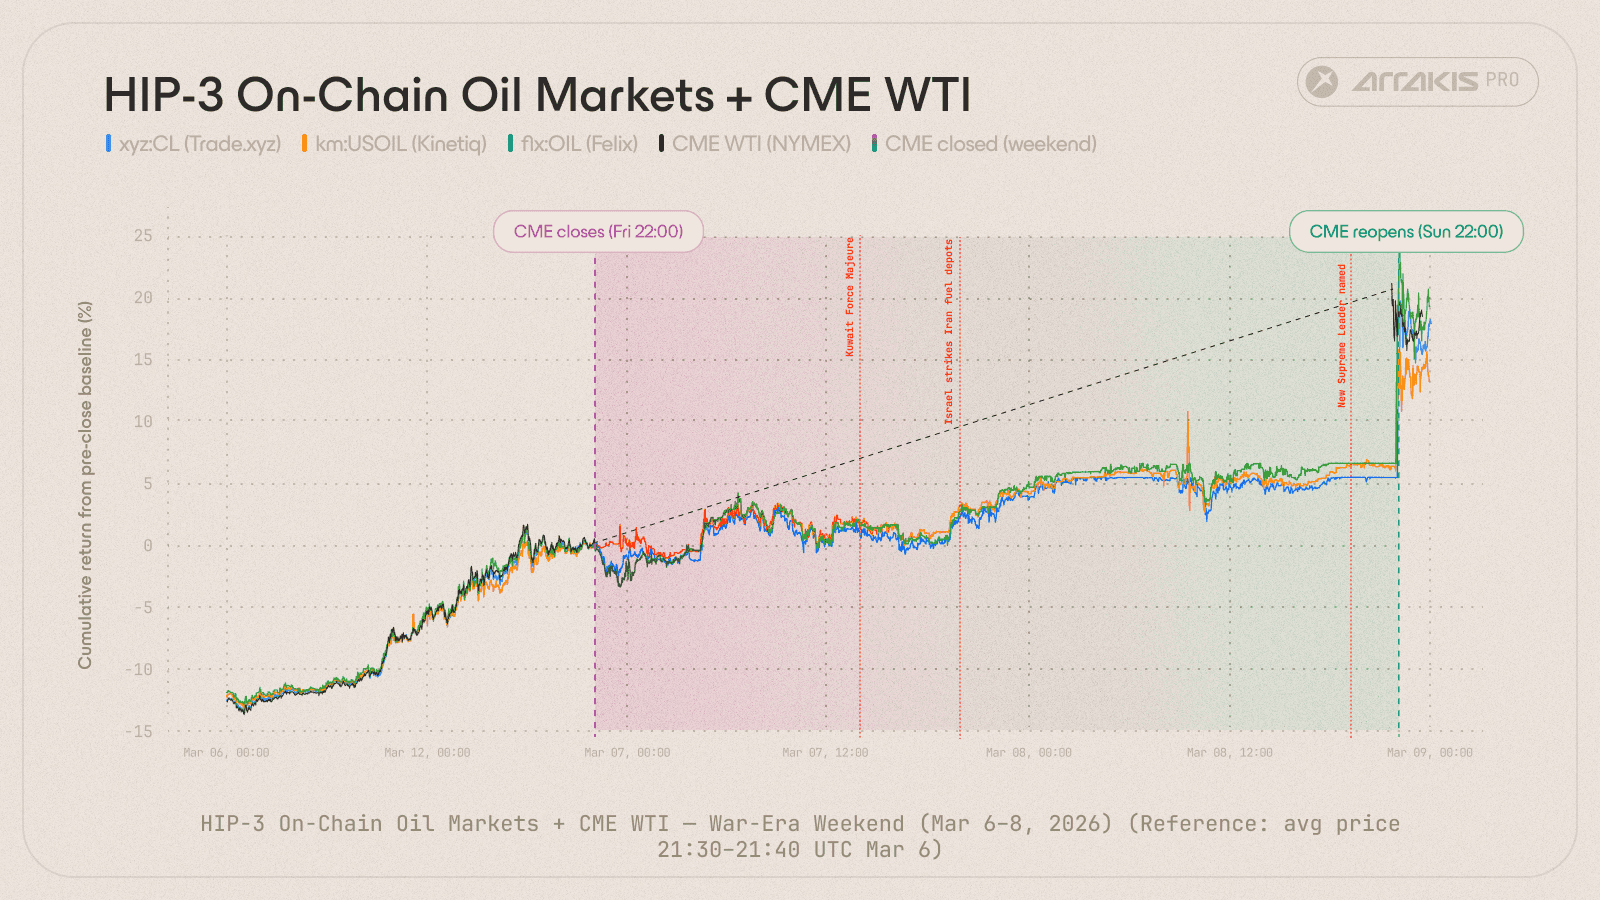
Three HIP-3 oil contracts vs CME WTI (cumulative % returns from pre-close baseline), Weekend 2. Three geopolitical events hit during the 48-hour CME closure. xyz:CL and flx:OIL flatline at their protocol caps, while km:USOIL trades freely. CME reopens at +20.7%, the bounded markets captured barely a quarter of the actual move.
When the CME reopened at 22:00 UTC on March 8 (one hour earlier than the previous week due to the start of US Daylight Saving Time), the first tick printed at $109.73, a +20.7% gap from the Friday close.
The same cap dynamics played out, now even more dramatically:
xyz:CL flatlined at $95.83 throughout the weekend, approximately +5.4% above the Friday close. With the CME reopening at +20.7%, xyz:CL was 13.9% below fair value at the ceiling. The protocol's 5% discovery bound captured barely a quarter of the actual move.
flx:OIL capped at roughly $94.93, about +4.4% above close. Even tighter than weekend 1, consistent with the funding rate cap binding at a lower threshold as market stress increased.
Despite these protocol-level limitations, there was a meaningful improvement in cross-venue pricing from the first weekend to the next, signalling higher market efficiency week over week.
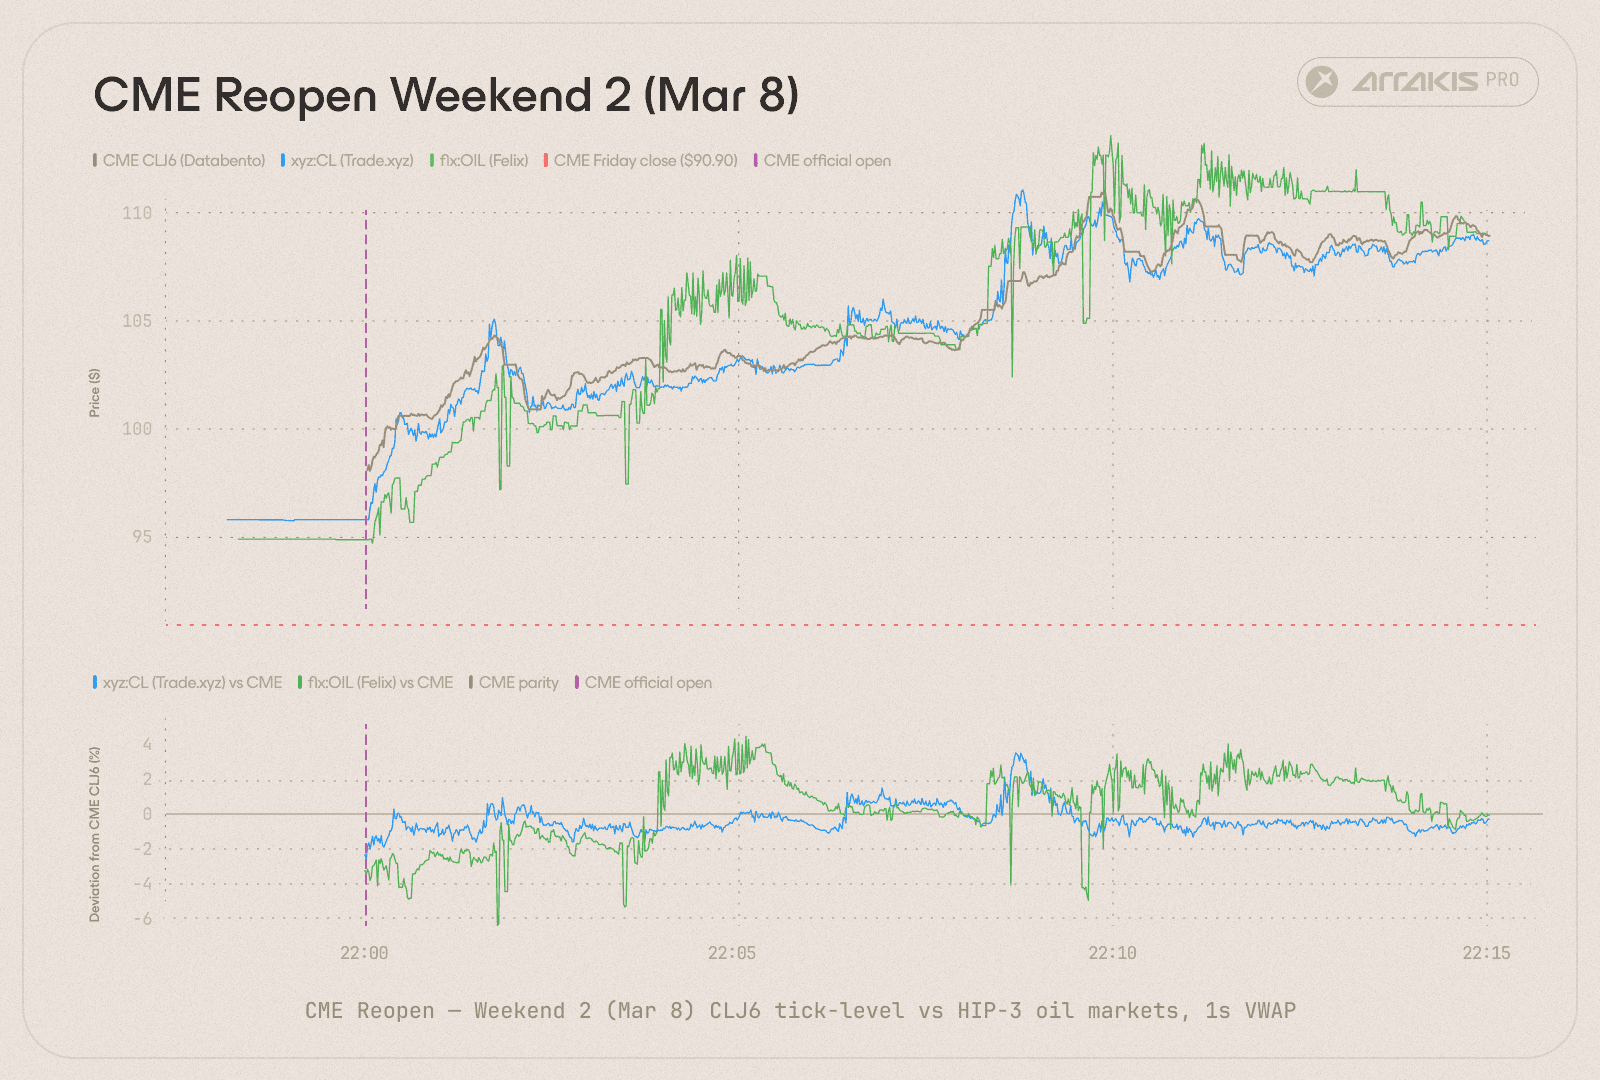
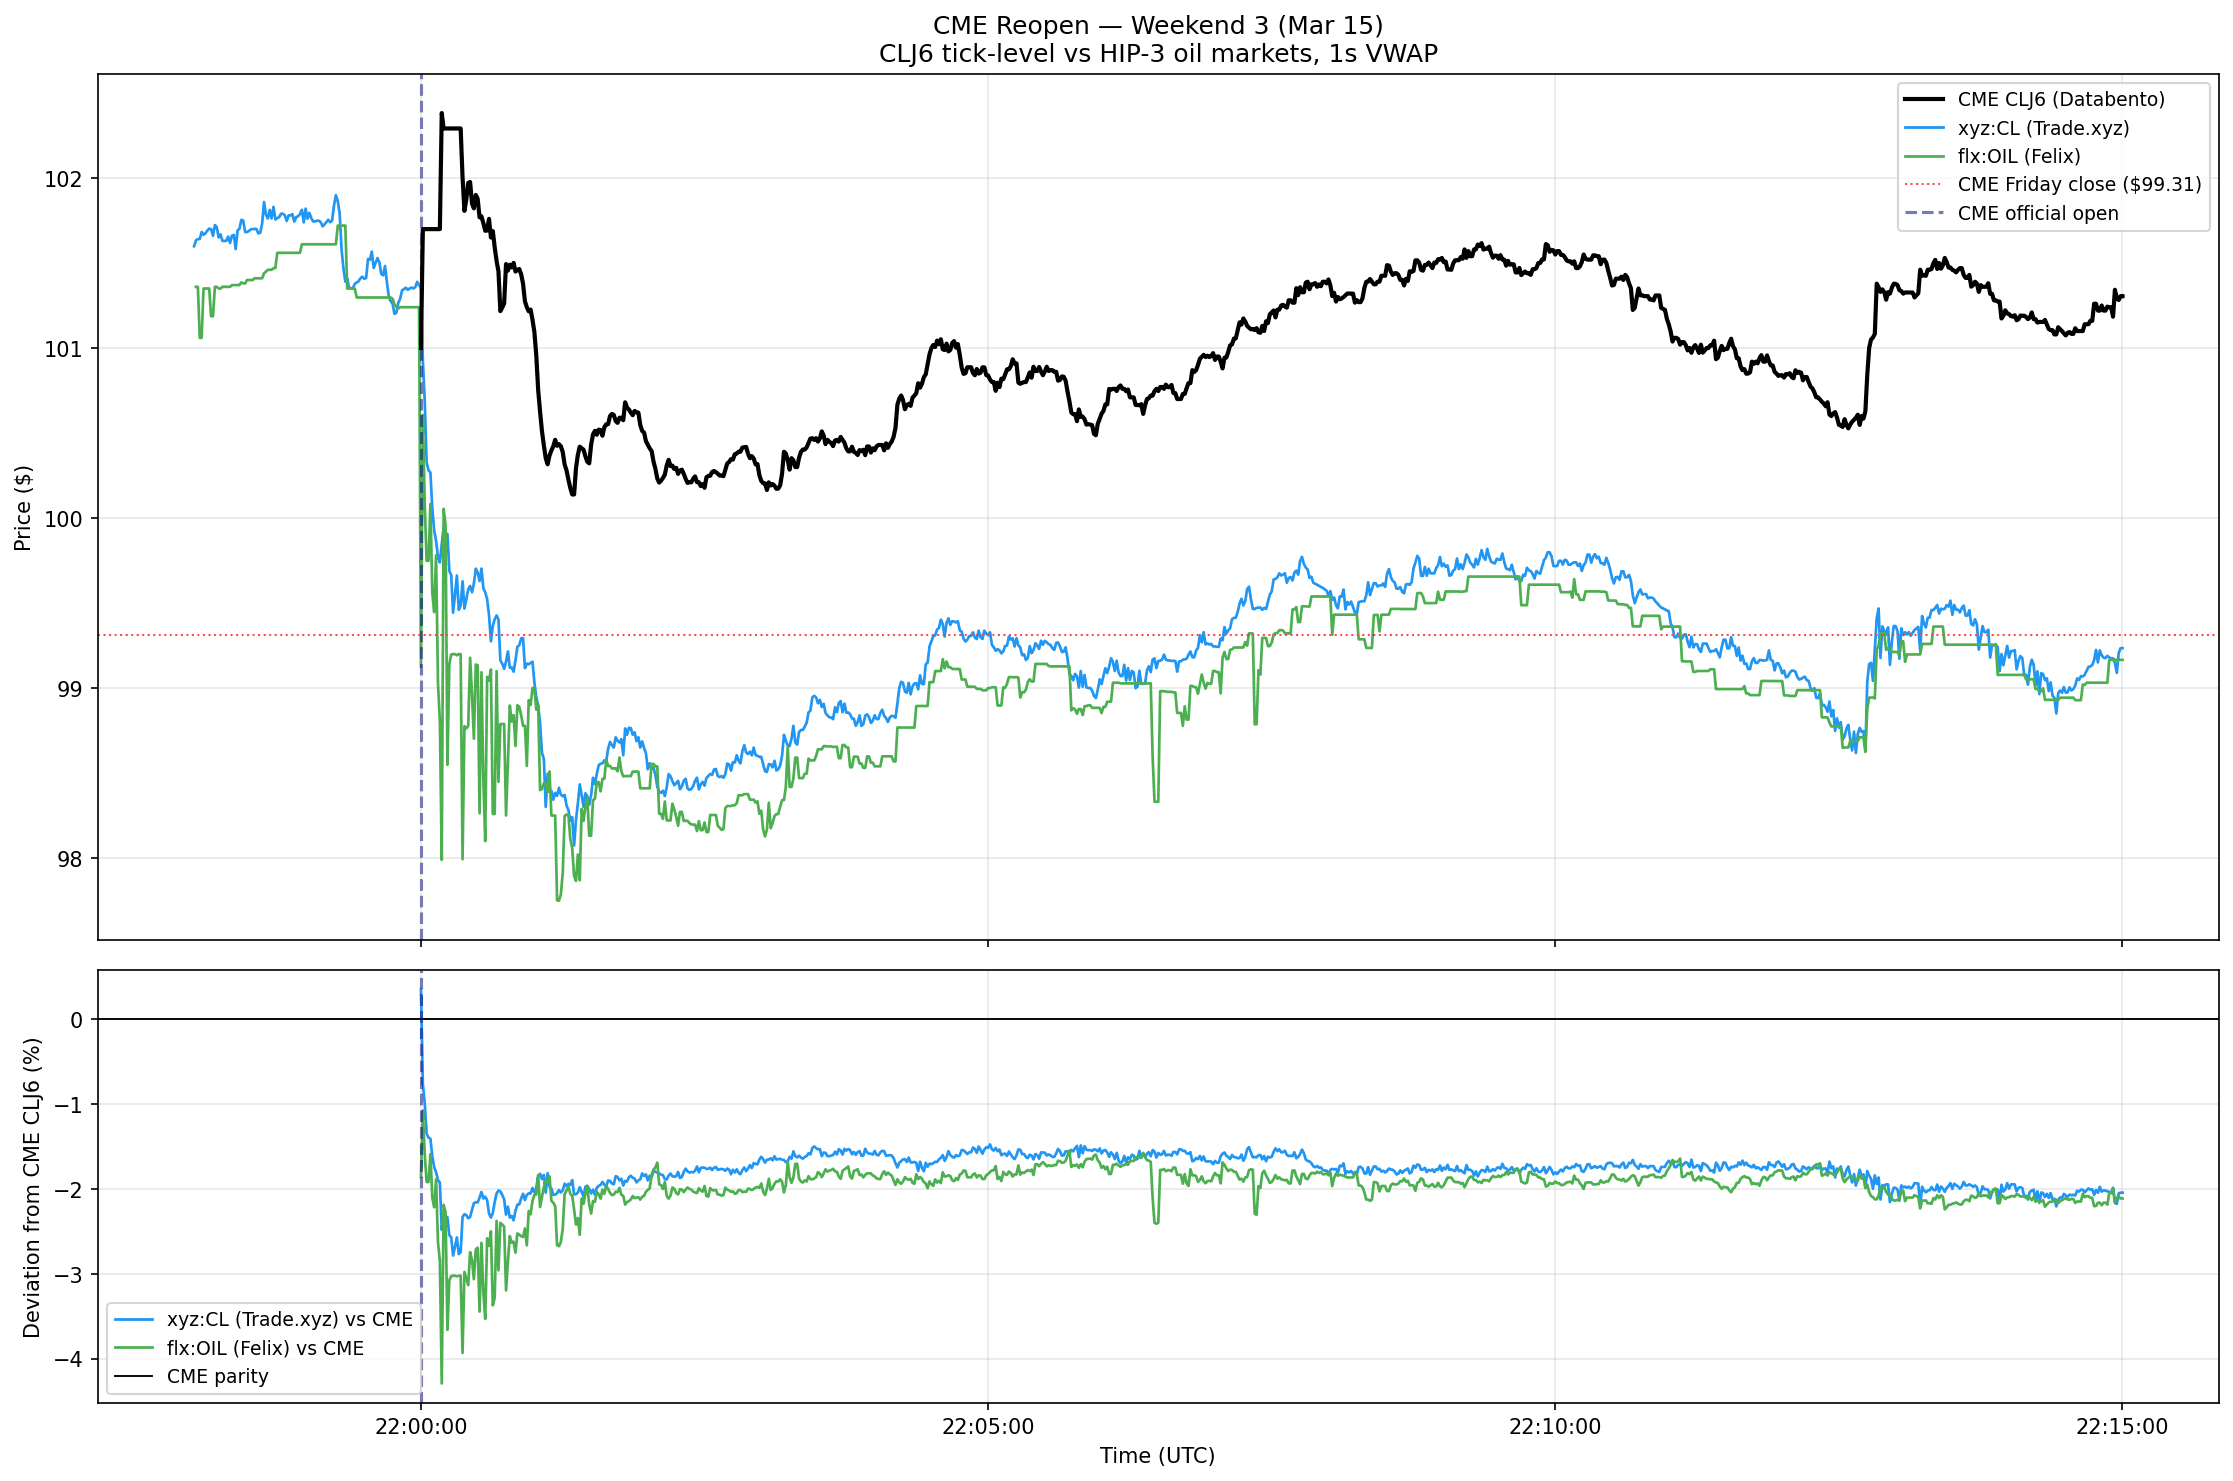
CME CLJ6 1-second time series vs HIP-3 markets at 1-second VWAP for the first 1 Weekend 2 reopen. Top: CME's first tick prints at $98.00 and rips to $109+ while xyz:CL and flx:OIL start pinned at their caps ($95.83 and $94.93). Both snap upward once CME opens. Bottom: xyz:CL converges within seconds; flx:OIL takes longer and oscillates wider before settling.
Market | 10-min Mean Absolute Deviation from CME |
|---|---|
xyz:CL (Trade.xyz) | 0.76% |
flx:OIL (Felix) | 1.84% |
Weekend two’s tick-level CME data from Databento paired against Hyperliquid fills at 1-second resolution reconfirmed our findings: xyz:CL converged tighter than flx:OIL.
Weekend 3: The New Normal
By the third weekend, Hyperliquid's role as the after-hours oil venue was expected. On Friday, March 13th at 21:00 UTC, the CME closed with WTI at $99.31, nearly 50% above pre-crisis levels. The conflict continued to escalate:
US strikes Kharg Island (22:54 UTC, Mar 13), Trump announced strikes on Iran's primary oil export terminal, responsible for roughly 90% of Iranian crude exports.
Fujairah oil facility hit (09:22 UTC, Mar 14), debris from intercepted drones struck UAE's Fujairah oil storage complex.
Iran selectively reopens Hormuz (10:56 UTC, Mar 14), Iran permitted select Indian and Turkish vessels through the strait, signalling a shift from total blockade to political leverage.
Iran threatens Gulf infrastructure by name (13:26 UTC, Mar 14), IRGC publicly named Jebel Ali, Khalifa Port, and Fujairah as potential targets.
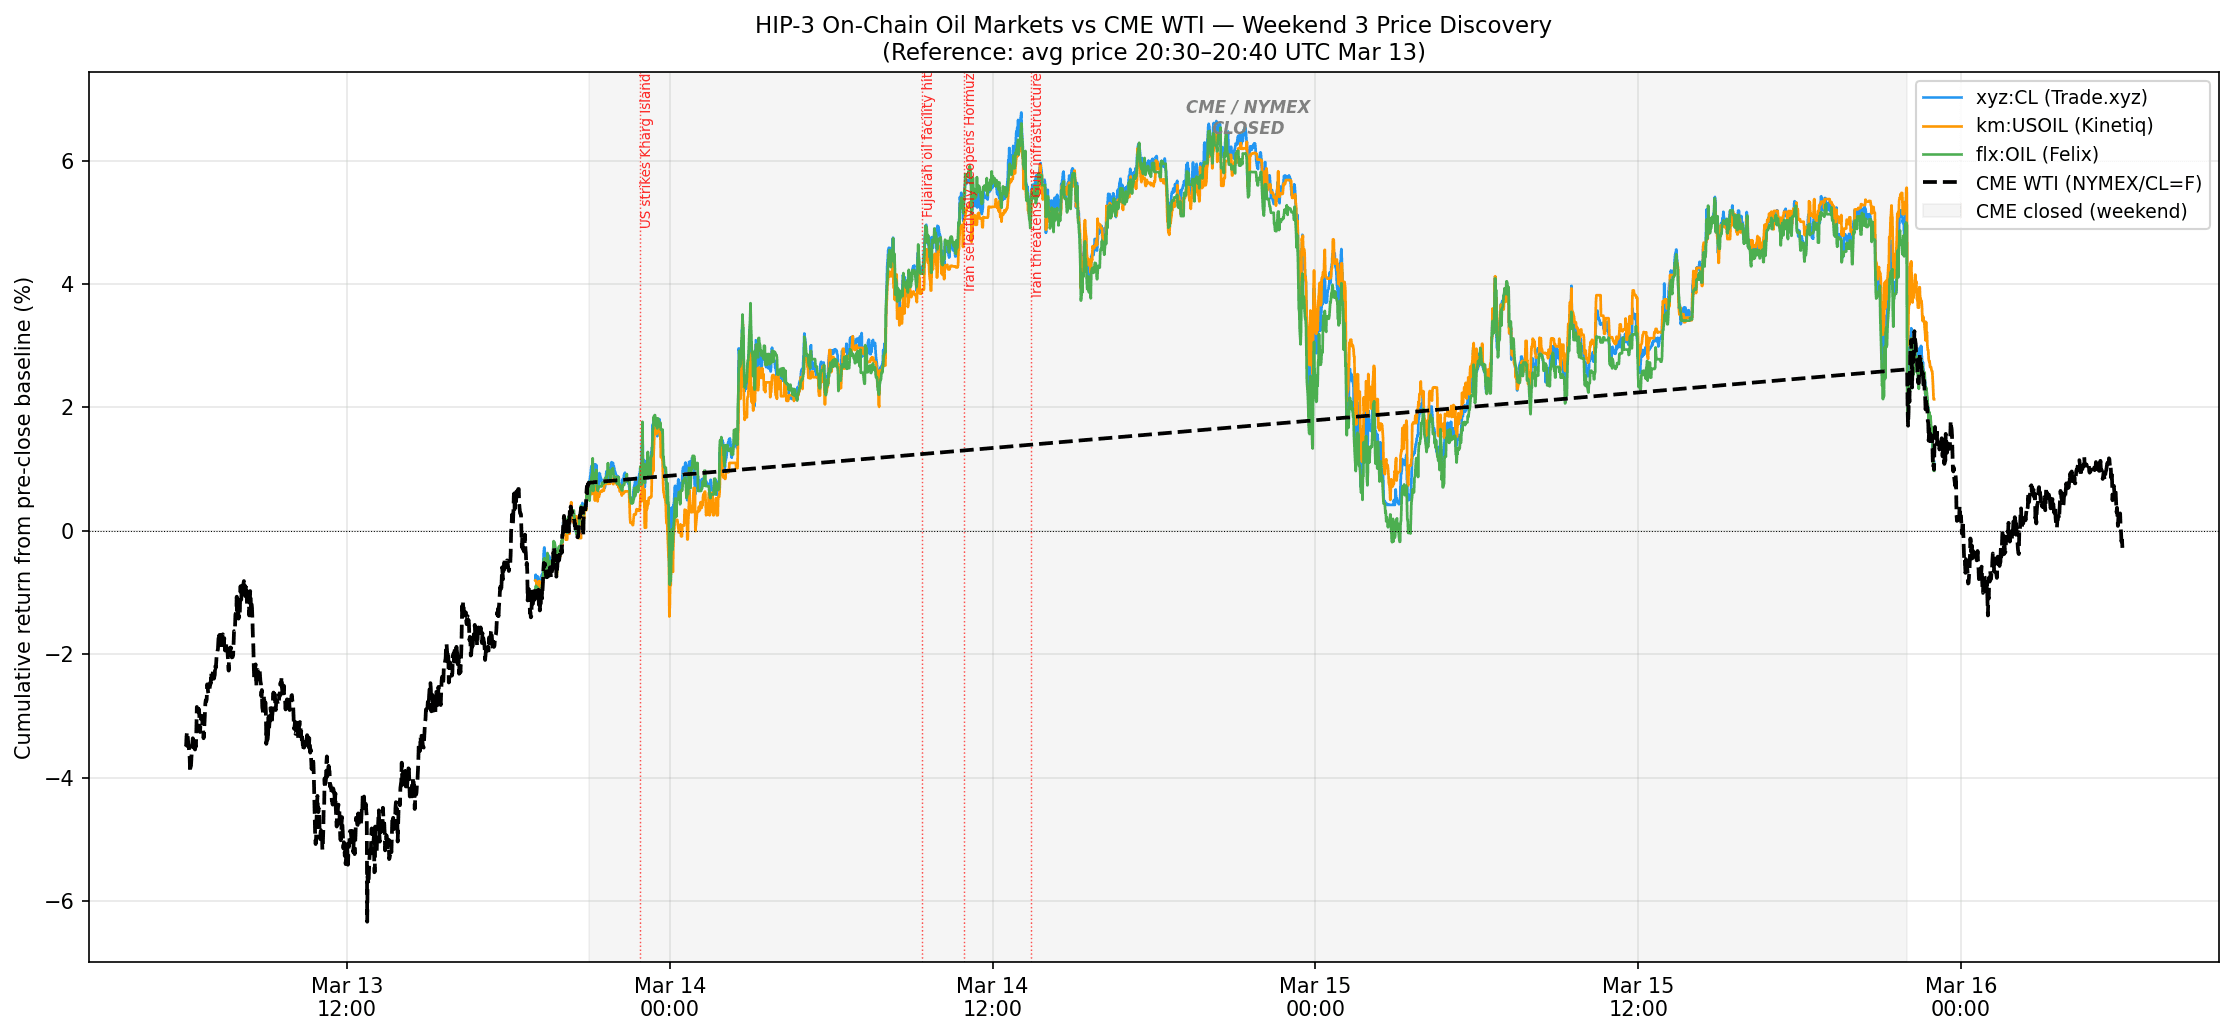
Three HIP-3 oil contracts vs CME WTI (cumulative % returns from pre-close baseline), Weekend 3. Four geopolitical events hit during the CME closure. Unlike previous weekends, discovery bounds did not bind, prices moved freely within protocol caps.
Weekend 3 marked a structural shift for xyz:CL, Trade.xyz launched Discovery Bounds V2 for xyz:CL ahead of the weekend, directly addressing the hard price ceiling that had constrained Weekends 1 and 2.
Bound width is now set independently of leverage, and bounds are dynamic, allowing continued price discovery without waiting for the CME to reopen.
In Weekend 3, the CME reopened at just +2.62% above the Friday close. The HIP-3 markets had peaked at +6.78% before pulling back, correctly anticipating the smaller gap. The hard ceiling of ±5% that defined Weekends 1 and 2 no longer existed for xyz:CL.
Convergence at Reopen
Tick-level fills in the 15 minutes after CME reopens (Mar 15, 22:00 UTC). xyz:CL starts within 0.35% of the CME; flx:OIL within 1.86%. Both track CME closely from the first second of paired data. NOTE: Both markets are tracking following month’s futures contract (CLK6) rather than the front month baseline mentioned in the chart (CLJ6)
Market | 10-min MAD from CME (W3) | W1 | W2 |
|---|---|---|---|
xyz:CL (Trade.xyz) | 1.74% | 0.60% | 0.76% |
Cell 2-1 | 1.98% | 1.29% | 1.84% |
Weekend 3 produced the highest deviations from CME baseline across both contracts, driven by a structural cause: contract roll. CLJ6 (April WTI) expires on 20 March, five trading days after the W3 CME reopen on 15th March.
For xyz:CL, Trade.xyz migrated the oracle from CLJ6 to CLK6 (May WTI) ahead of Weekend 3. The 1.74% mean deviation measured against CLJ6 represents the spread between the two contracts.
Contract | Expiry | Last Price (Spread) | Volume |
|---|---|---|---|
CLJ6-CLK6 | 2026-03-20 | 1.76 | 9,676 |
For flx:OIL, Felix uses a dynamic blended oracle. The formula weights CLJ6 and CLK6 inversely by days remaining to expiry, shifting progressively toward CLK6 as the front-month approaches expiry.
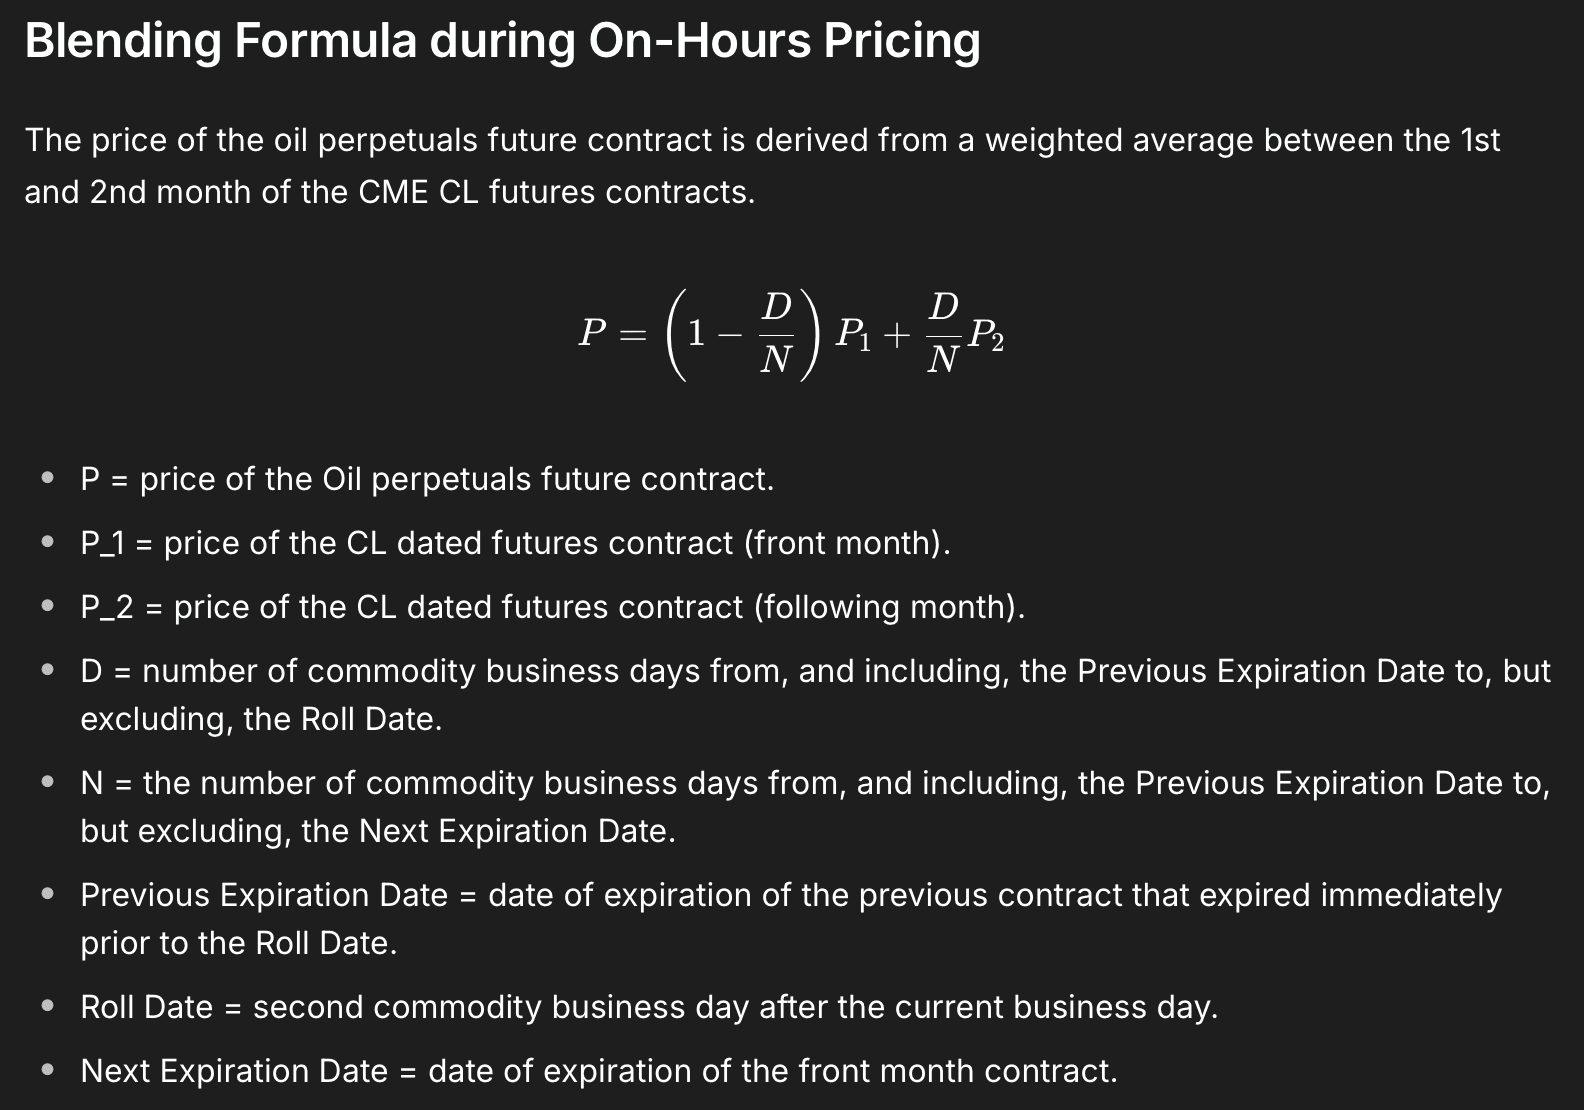
With five days left on CLJ6 at the W3 reopen, the blend had already shifted substantially toward CLK6. The deviation here partly reflects the roll basis embedded in the oracle price, not failure to converge.
Analysing the Orderbook
How liquidity evolved between the weekends
xyz:CL's Weekend 1 orderbook looked deep at first glance: $3.65M within 2 bps of mid, 0.15 bps spread. But 99.8% of that depth sat on the bid side.
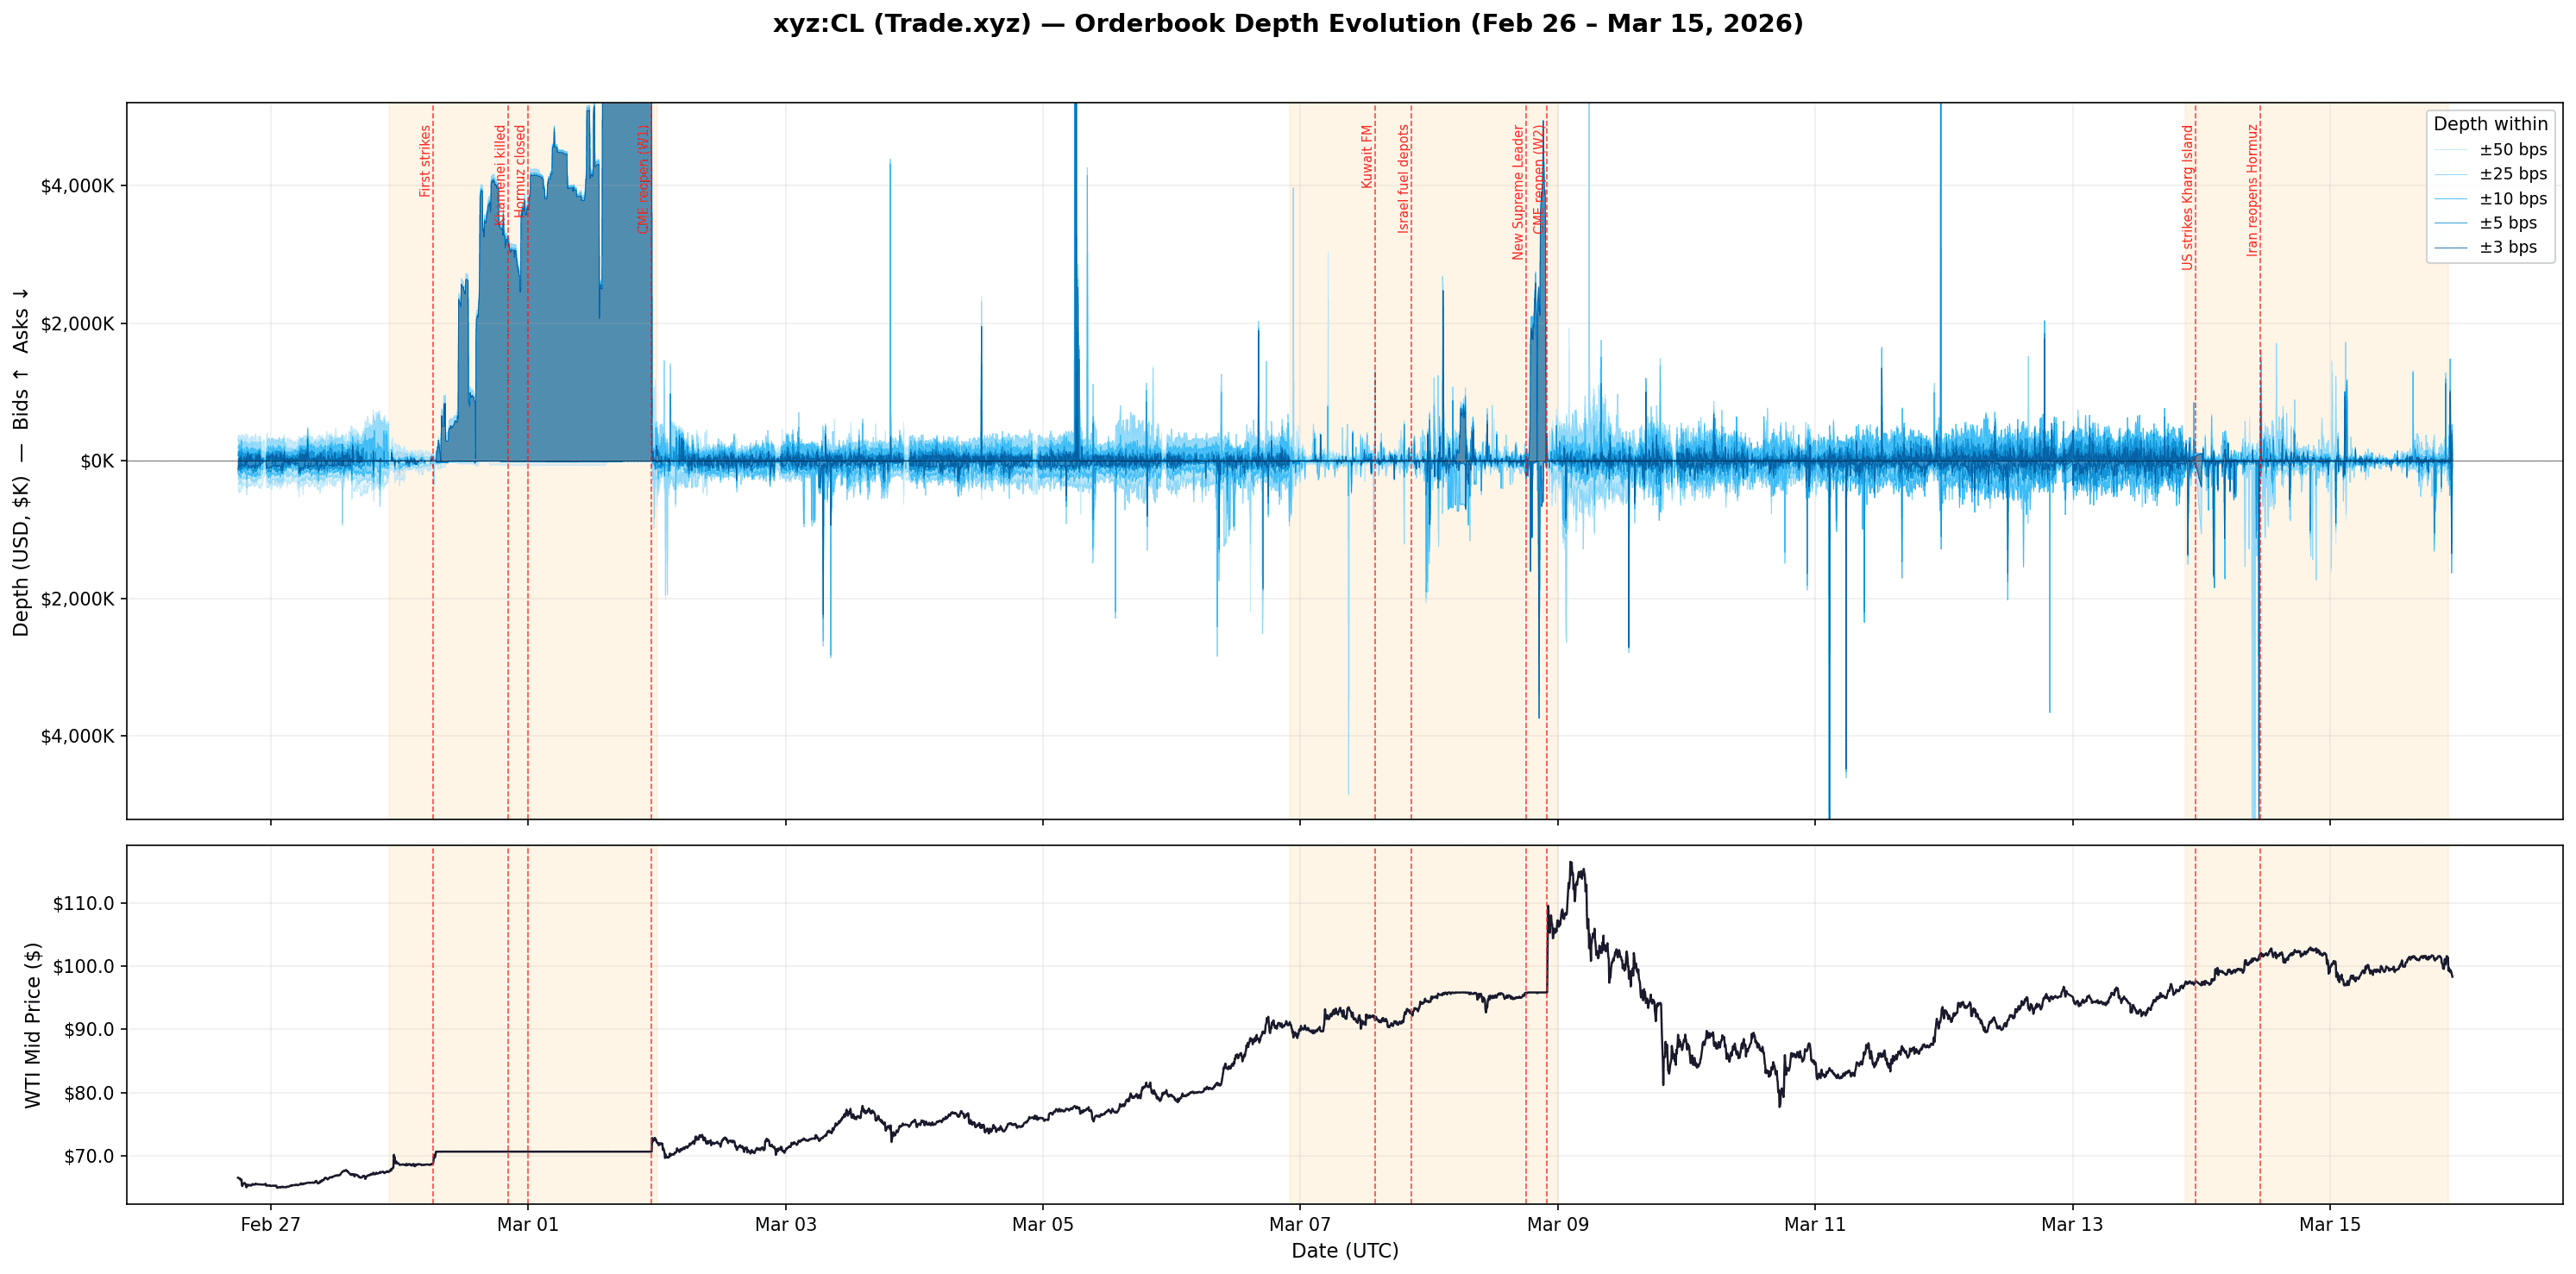
Liquidity depth for Bid and Ask side of the orderbook for xyz:CL from weekend 1 to weekend 2 and between
At 2 bps from mid, bid depth was $3,644,914. Ask depth was $7,109. The ratio was roughly 500:1.
During Weekend 1, depth was nearly flat from 2 to 50 bps, because virtually all of it was parked at a single price level.
Band | Weekdays (Median) | Weekend 1 (Median) | Weekend 2 (Median) | Weekend 3 (Median) |
2 bps | $0 | $3,652,094 | $0 | $2,849 |
5 bps | $158,547 | $3,656,467 | $14,798 | $36,642 |
10 bps | $368,222 | $3,687,399 | $67,066 | $118,341 |
25 bps | $579,428 | $3,747,119 | $203,252 | $266,743 |
50 bps | $621,421 | $3,803,144 | $258,855 | $278,649 |
Spread | 4.1 bps | 0.15 bps | 4.2 bps | 3.6 bps |
xyz:CL median orderbook depth (USD) at various distances from mid price. Weekend 1 depth was 6-10x higher than weekdays at every band, but nearly all of it was concentrated at a single price level. By Weekend 3, depth at ±10 bps had grown to $118K (2.5x Weekend 2), with the tightest spreads of any weekend at 3.6 bps.
The bid/ask breakdown makes the asymmetry explicit:
Band | Bid Depth | Bid % | Ask Depth |
2 bps | $3,644,914 | 99.8% | $7,109 |
10 bps | $3,680,025 | 99.8% | $8,233 |
50 bps | $3,743,070 | 98.4% | $60,110 |
This is the microstructure evidence of what the discovery ceiling described earlier looked like from inside the orderbook. Sellers had no incentive to offer at a price they knew was artificially capped below fair value, informed participants understood the bound was binding and the true clearing price was higher. The ask side was nearly empty as a result. What appears as $3.6M in liquidity was trapped demand accumulating against a structural wall, not healthy two-sided market making.
Cross-Venue Depth: Weekend 2
Weekend 2 had three active venues instead of one, 6.6x more volume, and no frozen price. The orderbook was structurally different, and much more revealing.
At first glance, total depth looked similar across all three markets. Within ±100 bps of mid, xyz:CL carried $208K, km:USOIL $252K, and flx:OIL $216K. Three independently deployed markets, built by different teams, converging on roughly the same total liquidity for the same underlying commodity. But where that liquidity sat varied dramatically.
Band | xyz:CL (Trade.xyz) | km:USOIL (Kinetiq) | flx:OIL (Felix) |
Median Spread | 4.2 bps | 9.6 bps | 18.3 bps |
±5 bps | $12,837 | $36 | $0 |
±10 bps | $47,114 | $4,190 | $716 |
±25 bps | $153,511 | $27,145 | $21,471 |
±50 bps | $205,281 | $76,050 | $67,688 |
±100 bps | $207,977 | $251,696 | $215,827 |
Median orderbook depth (USD) at various distances from mid price across HIP-3 oil markets during Weekend 2. Based on 325,000+ L2 snapshots per market across the full 50-hour window.
xyz:CL packed its liquidity tight against the mid price. At ±10 bps it held $47K, 11x more than km:USOIL and 66x more than flx:OIL at the same distance. And virtually all of xyz:CL's depth sat within ±50 bps ($205K vs $208K at ±100 bps, barely $3K between 50 and 100 bps). This was a concentrated, tightly quoted book.
Another important structural difference from Weekend 1 was on the bid/ask axis. Weekend 1's book was 99.8% bid-side while Weekend 2's books were balanced: xyz:CL ran 61/39 bid/ask (a mild bullish skew consistent with escalation positioning), km:USOIL was 49/51, flx:OIL was 51/49. There was genuine two-sided market making across three competing venues.
Cross-Venue Depth: Weekend 3
By the third weekend, xyz:CL's orderbook matured further. Spreads tightened to 3.6 bps (from 4.2 bps in Weekend 2), and depth at ±10 bps grew 2.5x to $118K.
Band | xyz:CL (Trade.xyz) | km:USOIL (Kinetiq) | flx:OIL (Felix) |
Median Spread | 3.6 bps | 8.0 bps | 13.8 bps |
±5 bps | $36,642 | $654 | $0 |
±10 bps | $118,341 | $11,759 | $2,775 |
±25 bps | $266,743 | $79,470 | $50,405 |
±50 bps | $278,649 | $237,271 | $160,106 |
Median orderbook depth (USD) at various distances from mid price across HIP-3 oil markets during Weekend 3.
The hierarchy between venues persisted: xyz:CL maintained the tightest spreads and deepest near-mid liquidity, km:USOIL sat in the middle, and flx:OIL was the widest. But all three improved relative to Weekend 2. km:USOIL's depth at ±25 bps nearly tripled (from $27K to $79K), and flx:OIL's median spread narrowed from 18.3 bps to 13.8 bps.
What This Means
Onchain commodity markets just had their proof-of-concept moment. During the largest oil supply disruption in modern history, when every traditional exchange was closed, oil traded on Hyperliquid. Over $900M in notional across three weekends, nearly 8,000 unique wallets at peak, and volume growing 22x from the first weekend to the third.
While the market is still young and has inefficiencies (discovery bounds, funding rate caps, cross-venue fragmentation), each weekend showed measurable improvement: tighter spreads, deeper books, faster convergence, and more balanced order flow. By the third weekend, the discovery bounds that constrained Weekends 1 and 2 were no longer binding, the market was operating within its protocol limits rather than against them.
The trajectory from $25M to $550M in three weeks, during an active geopolitical crisis, demonstrates that 24/7 onchain commodity markets are not a theoretical concept. They are a functioning market infrastructure with real participants, real price discovery, and real convergence to reference benchmarks.
Thanks to the many contributors and data sources that helped to make this analysis possible, including: Stacy Muur, Hydromancer and Archive.io

