Research

This article is published for informational and educational purposes only and does not constitute investment advice. Arrakis has made reasonable efforts to verify the accuracy of the data presented but does not warrant that all information is accurate, complete, or current.
Thank you to 0xArchive and Dune for their contributions to the research.
TL;DR
We analysed the major prediction market venues and their activity during the 2026 World Cup. After rebuilding Polymarket, Kalshi and Hyperliquid from their raw trade tapes across the nine knockout matches and the 48-team champion market, three things stood out:
70% of accounts lost money. Of 318,876 Polymarket accounts, 70.6% finished down, and the median account lost 75 cents.
The rake rests on a few hundred accounts. 319 accounts paid 51.7% of Polymarket's fees, and 174 of those finished the tournament at a loss.
Kalshi is where the money trades during the match. 54.8% of its volume printed after kickoff against 41.4% on Polymarket, and in dollars that is more than five times as much live trading.
Introduction
Before Norway played Senegal in New Jersey in their group stage match, the stadium host asked the crowd to take out their phones, scan a QR code and predict the winner. That is a clear example of how deeply prediction markets were embedded in the 2026 World Cup.
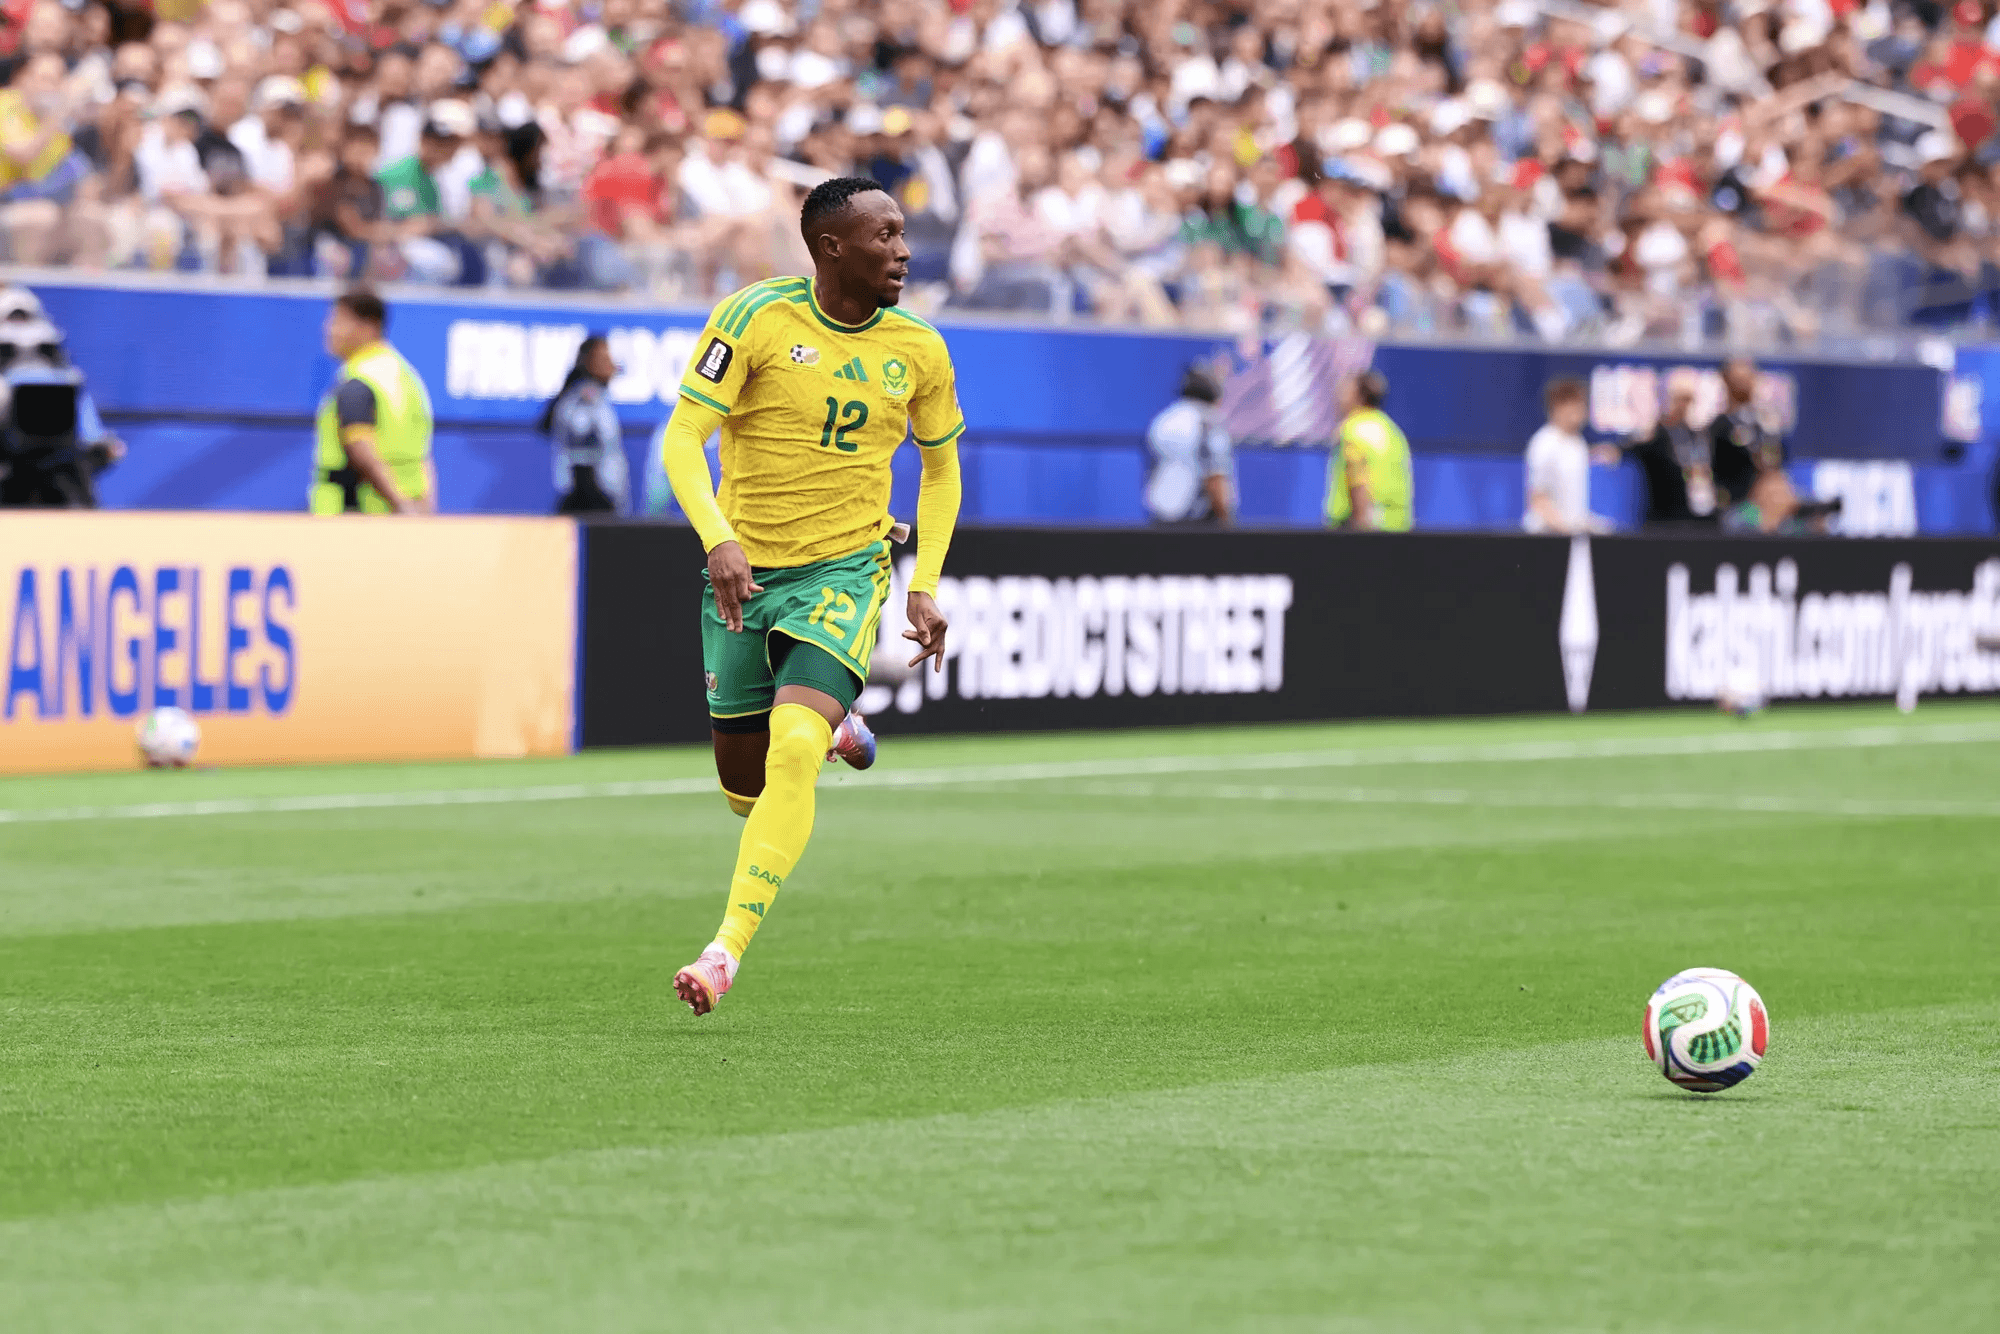
ADI Predictstreet, center, and Kalshi, right, advertisements during a World Cup match between Canada and South Africa at Los Angeles Stadium on June 28. Image Source: https://www.bloomberg.com/news/articles/2026-06-30/kalshi-finagled-a-world-cup-sponsorship-deal-at-a-deep-discount
Outside the stadium the signal was even louder. In Newark, LaGuardia, and JFK airports, across Times Square, through television ads, and beyond, prediction markets were everywhere.
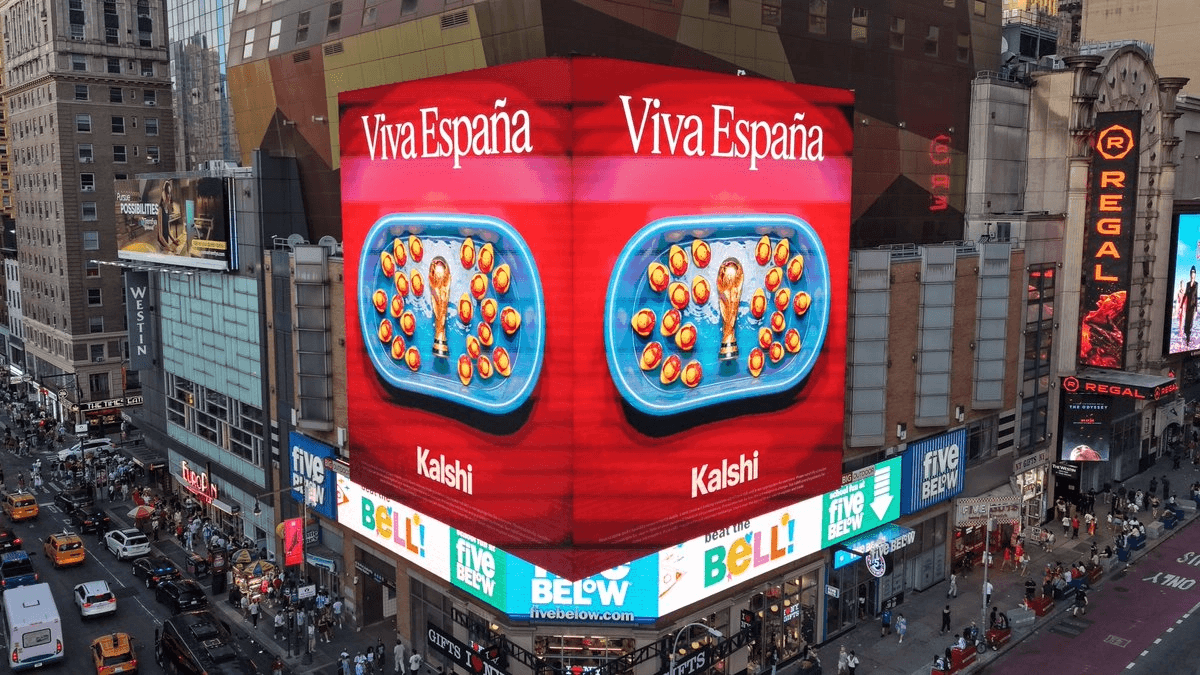
Image Source: https://x.com/KalshiFC/status/2079000961641484779?s=20
While the advertising was impossible to miss, what the money did was not, and that is what we explore in this piece. We rebuilt three major venues, Polymarket, Kalshi and Hyperliquid, from their raw trade tapes, and what comes out is a market where a third of a million accounts traded but only a few hundred of them took nearly all the money.
A tale of two fans
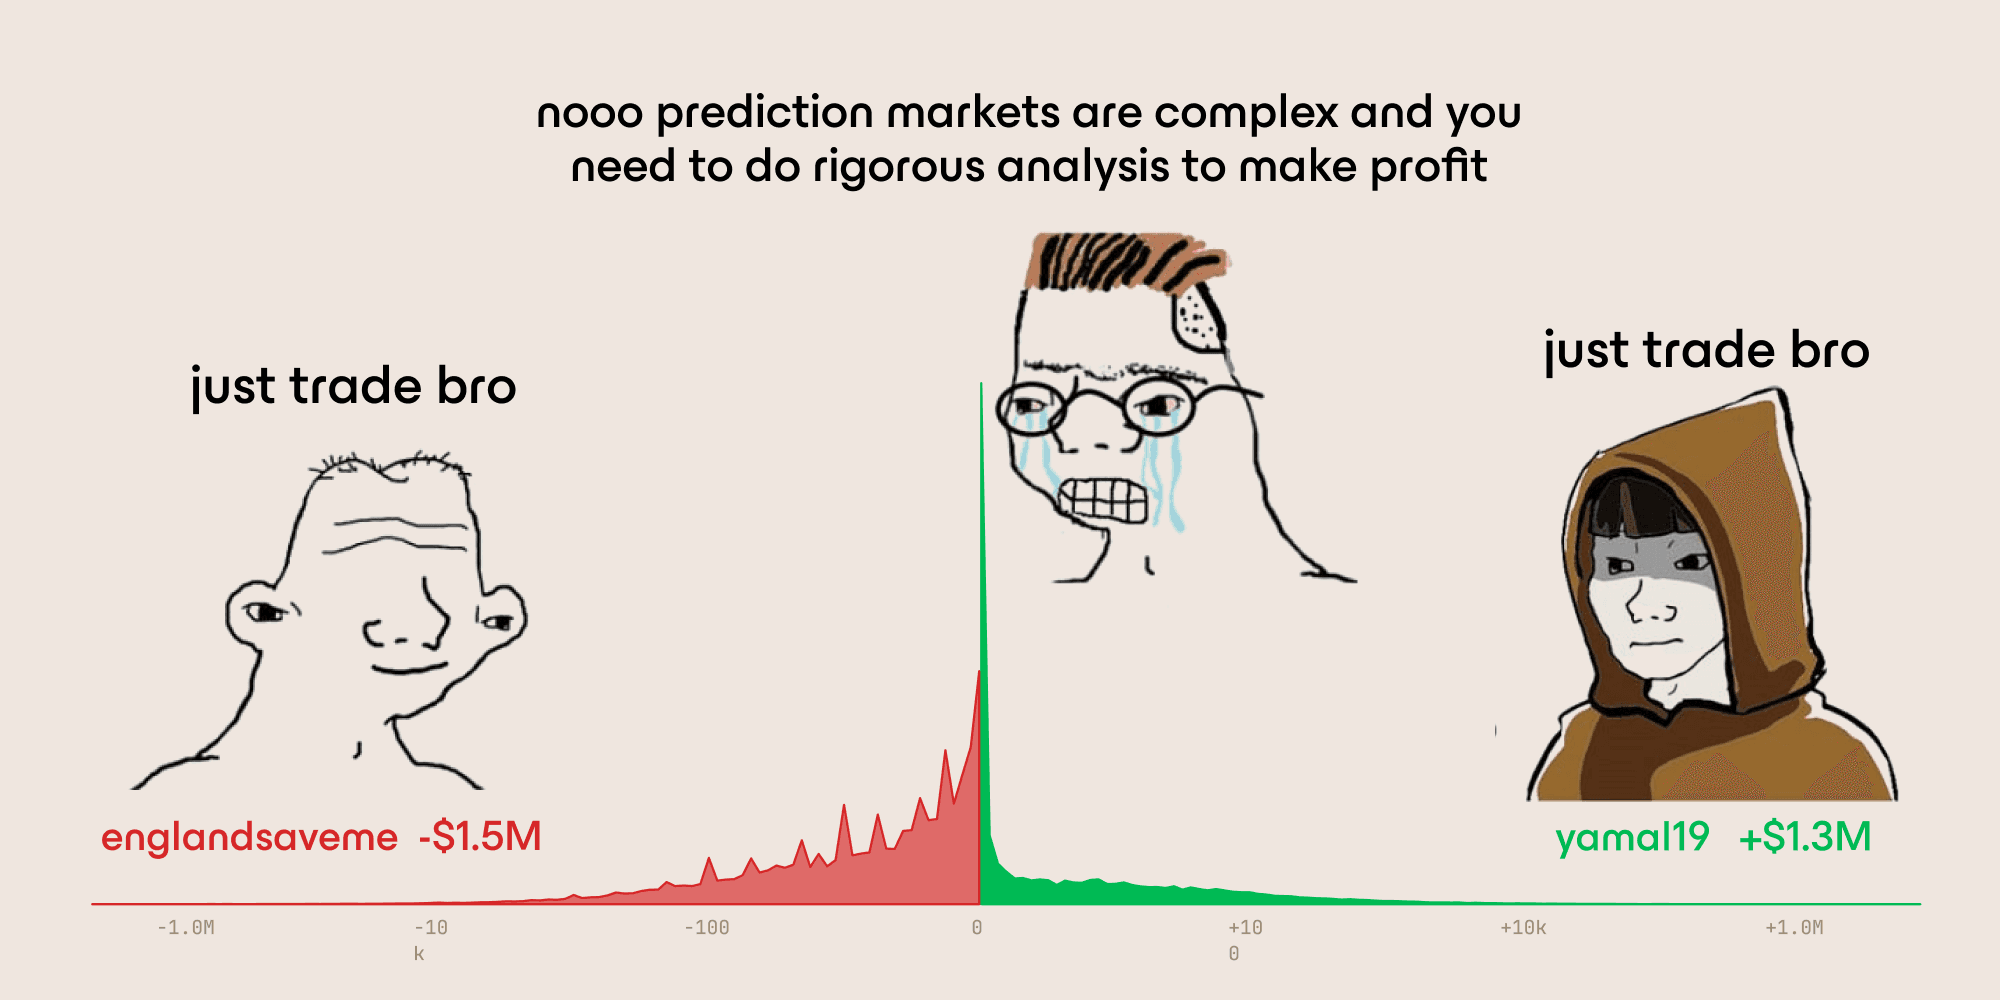
Of the 318,876 accounts that bet on the marquee World Cup markets on Polymarket, nearly 90% finished within $100 of where they started, and the median account lost 75 cents.
Two of these accounts managed to place themselves a long way outside that crowd, and both got there in a single bet on a single football match.

Distribution of profit and loss across all indexed 318,876 Polymarket accounts, with yamal19 and englandsaveme pinned in their tails.
Profit and loss | Rank | Matches traded | Registered | |
|---|---|---|---|---|
yamal19 | +$1,323,234 | 6th best of 318,876 | 1 | 19 July, the day of the final |
englandsaveme | -$1,506,980 | 5th worst of 318,876 | 1 | 15 July |
Neither of them hedged, and neither came back for a second market. Both opened an account just before their respective matches, bet once on their favourite teams, and walked away.
yamal19 moved $1.98M onto Polymarket on the morning of the final and bet all of it on Spain. Whoever assembled that money took some trouble over it, and the trail runs back into a Bitcoin CoinJoin and stops there.
englandsaveme, on the other hand, asked England to save them. Unfortunately, England did not.
Forget who won and the two bets look very alike. Each picked one market to trade on their favourite teams, staked seven figures, and never traded again in the tournament.
How much volume did each venue do
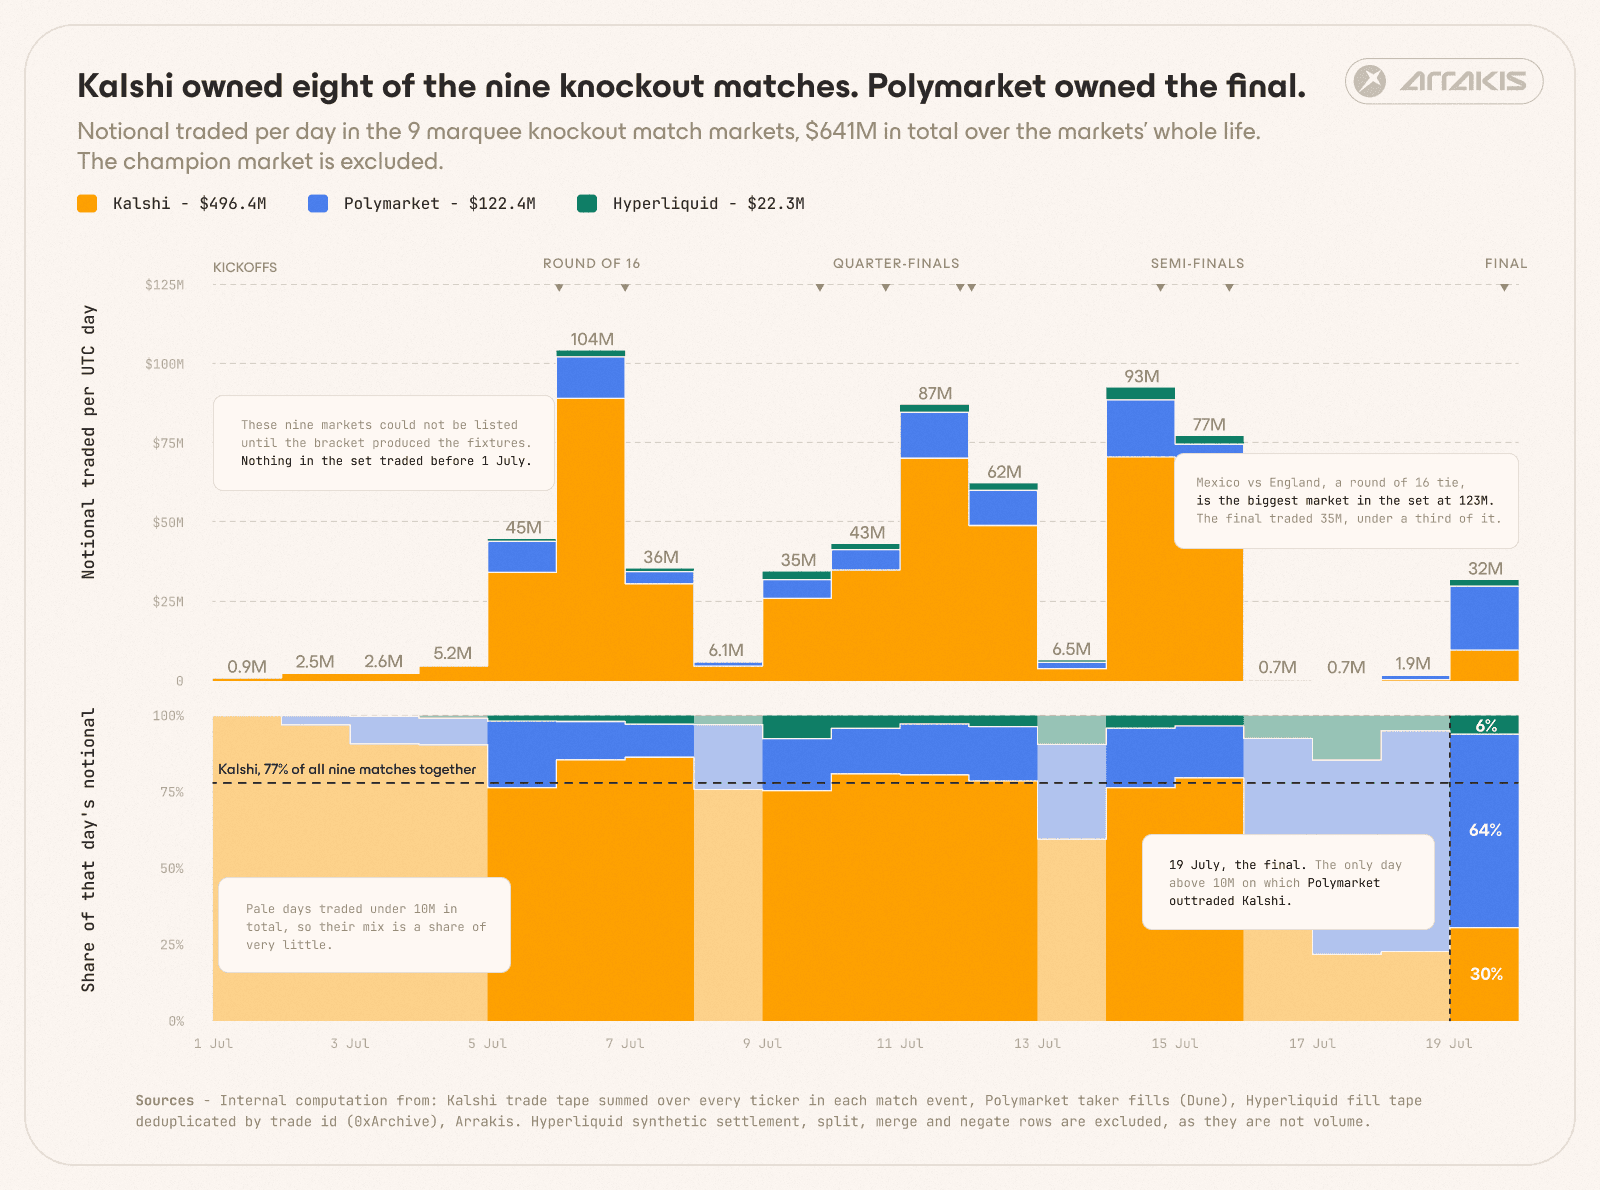
Daily notional across the nine knockout matches by venue, with the share view beneath. Post-result closeout is counted here, as it is in the published venue totals.
Polymarket | Kalshi | Hyperliquid | |
|---|---|---|---|
Match markets (9) | $122M | $495M | $22.3M |
Champion (48 teams) | $613M | $206M | $49.3M |
Total | $735M | $700M | $71.6M |
All three venues listed the same nine matches and the same champion market. What separated them was which of those markets the money went into.
Those nine are the two Round of 16 ties that all three venues listed, the four quarterfinals, both semifinals and the final: Mexico against England, USA against Belgium, France against Morocco, Spain against Belgium, Norway against England, Argentina against Switzerland, France against Spain, England against Argentina, and Spain against Argentina in the final. Together they account for 42.9% of all the money bet on worldcup matches.
Polymarket and Kalshi finished only $35M apart in total volume, however, Kalshi did between 74% and 85% of the volume on the individual match markets in every one of the first eight knockout matches, while Polymarket took two thirds of the champion market.
The final turned it over. Kalshi's share of match volume dropped to 30% on 19 July while Polymarket's climbed to 64%. Throw out every trade that happened after the whistle and Polymarket still did $20.8M that day against Kalshi's $10.6M.
The two user bases showed very different trading behaviours. Polymarket's users had bought the champion market before the matches even happened, and the final is where that bet pays out, hence it isn’t surprising that they dominated in volumes in that match.
Kalshi’s users bet on the individual match markets instead.
Hyperliquid acquired 10% of the volume of Polymarket from only 2% of the accounts, 6,618 against Polymarket's 318,876. Whoever traded there moved roughly five times as much money per account.
Kalshi is where the money traded during the match
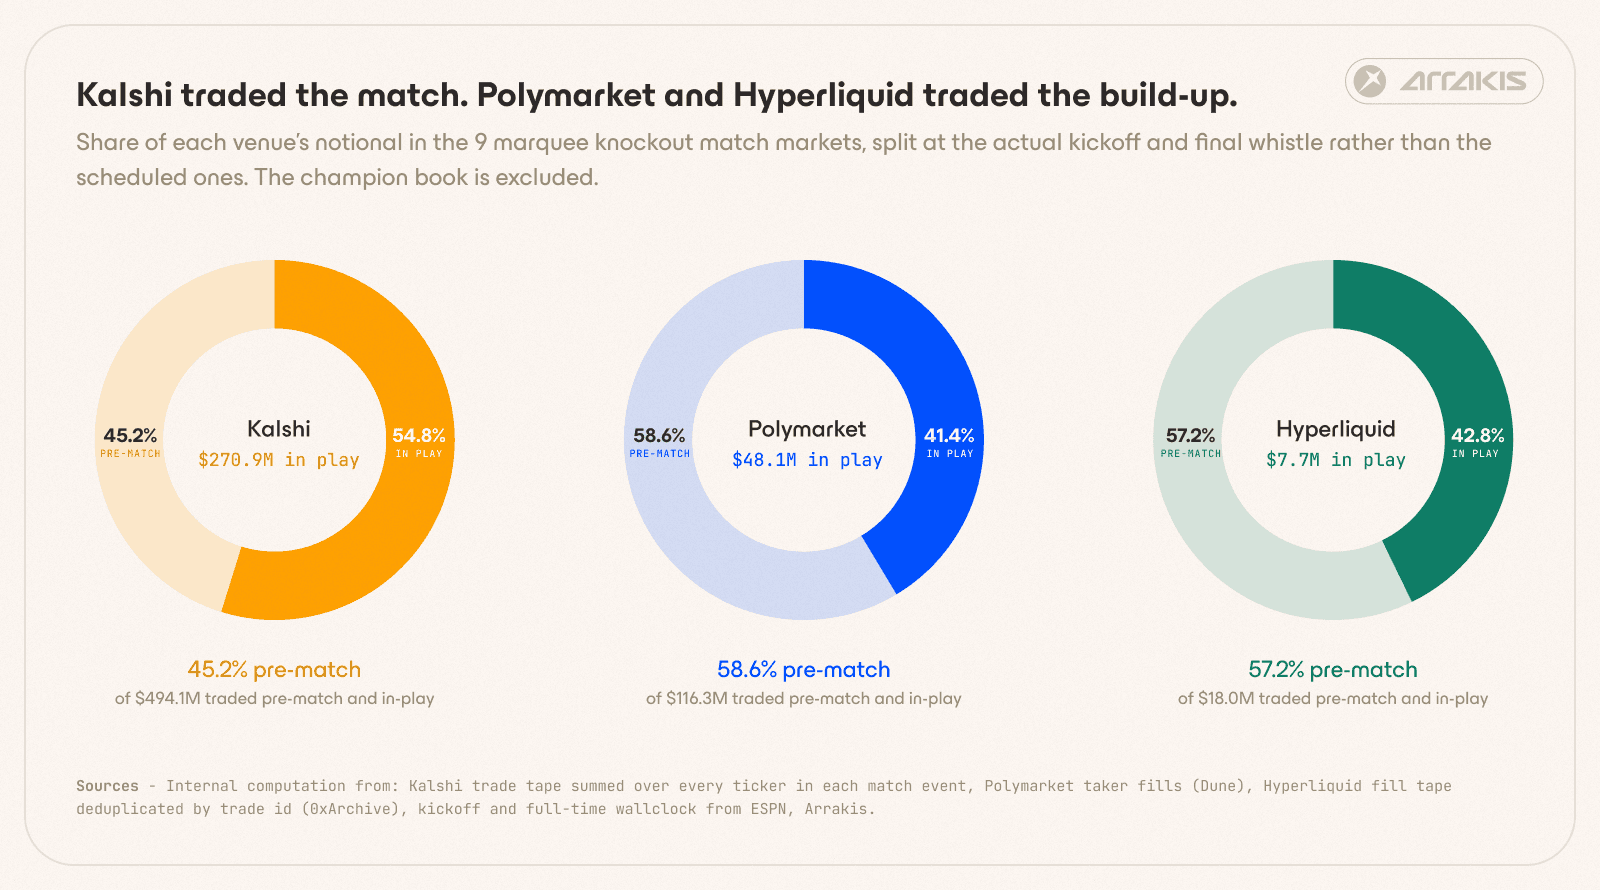
Pre-match against in-play volume, one ring per venue. Extra time counts as in-play, and post-whistle closeout is excluded, because it prints at settled prices and it generally encompasses position unwinding rather than betting.
Venue | Pre-match | In play |
|---|---|---|
Kalshi | 45.2% | 54.8% |
Polymarket | 58.6% | 41.4% |
Hyperliquid | 57.2% | 42.8% |
Kalshi's traders bet while the ball was rolling. Polymarket's placed their bets and then sat down to watch the game.
The percentages understate how far apart they were. Kalshi's customers put $270.9M into live games against Polymarket's $48.1M, so Kalshi was a 5x more active venue after kickoff, even though its total volume across the tournament was slightly smaller.
Hyperliquid behaved similarly to Polymarket, at 57.2% of volume happening pre-match.
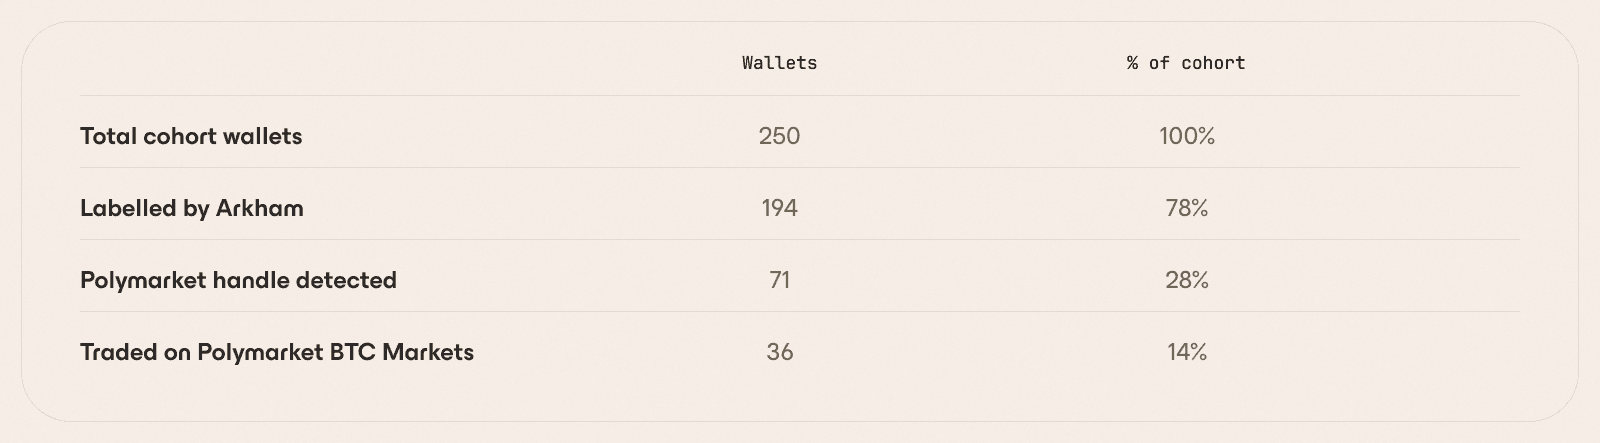
Source: Two Weeks of HIP-4: A Forensic Look at Hyperliquid's Outcome Markets, Dated: 2026-05-21
Polymarket's busiest five minutes of the whole tournament were the five before a kickoff. Its volume then fell by more than half at the whistle and climbed back through the second half to twice what it had been an hour before kickoff.
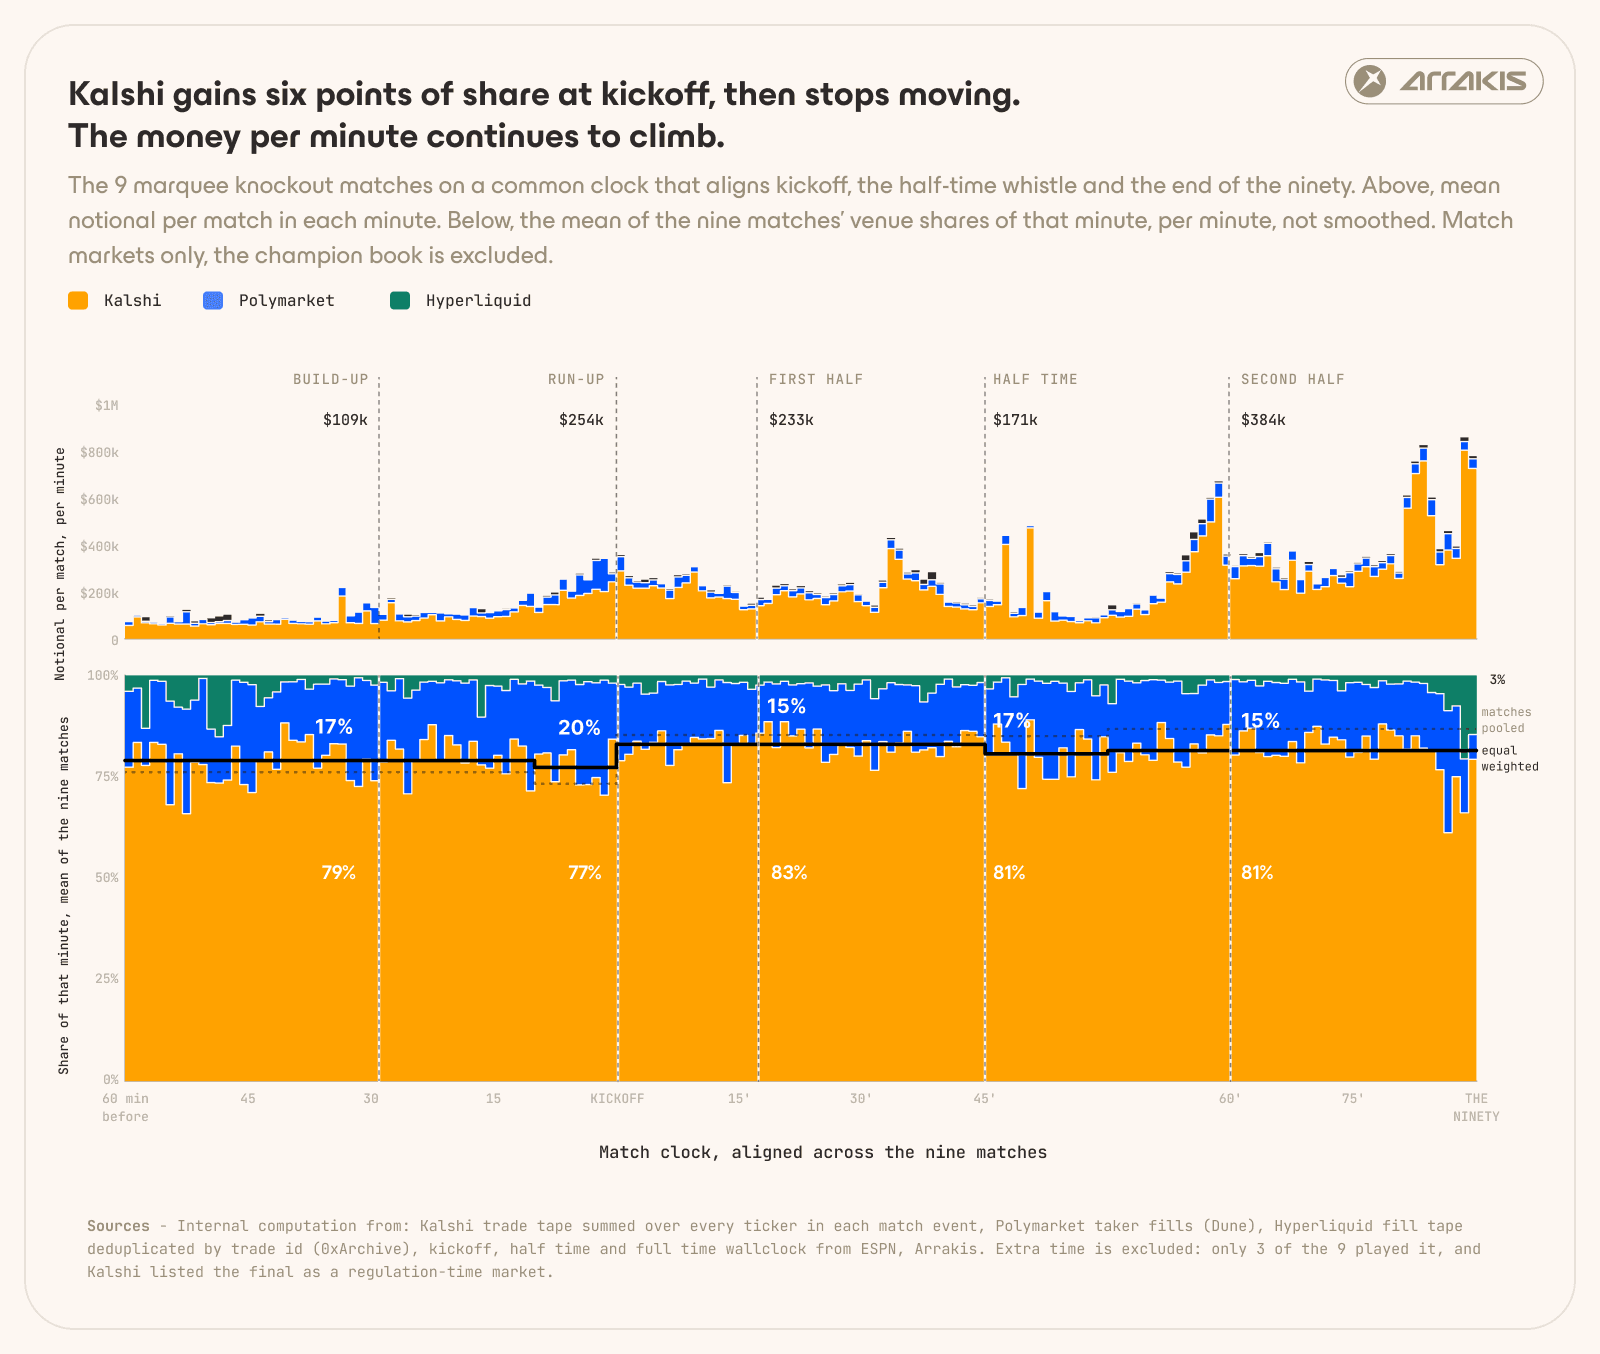
The venue mix minute by minute, averaged across the nine knockout matches, from an hour before kickoff to the final whistle, excluding extra time because Kalshi listed the final as a regulation-time market. The mix barely moves. What changes is the money: a match-minute trades three times more in the second half than before kickoff.
Traders priced Saka's penalty before he took it
The bronze final showed how fast a prediction market book can move. France played England for third place on 18 July, and Saka scored from the penalty spot in the 87th minute. Between 22:37 and 22:47 UTC, the ten minutes covering the foul, the VAR review and the referee's confirmation, Dune found traders marking France down by 31 percentage points. Saka converted at 22:49 and the price moved a further 3. The market had already priced in the goal before it even happened.
Dune reports the same shape on Oyarzabal's penalty in the 22nd minute of France against Spain, where 85% of a 26 point move landed before contact. Open-play goals get priced inside the minute the ball crosses the line, because nobody sees those coming.
In both cases the market moved when the information arrived rather than when the goal did. A penalty award is information several minutes before anyone takes the kick, and the book treats it that way.
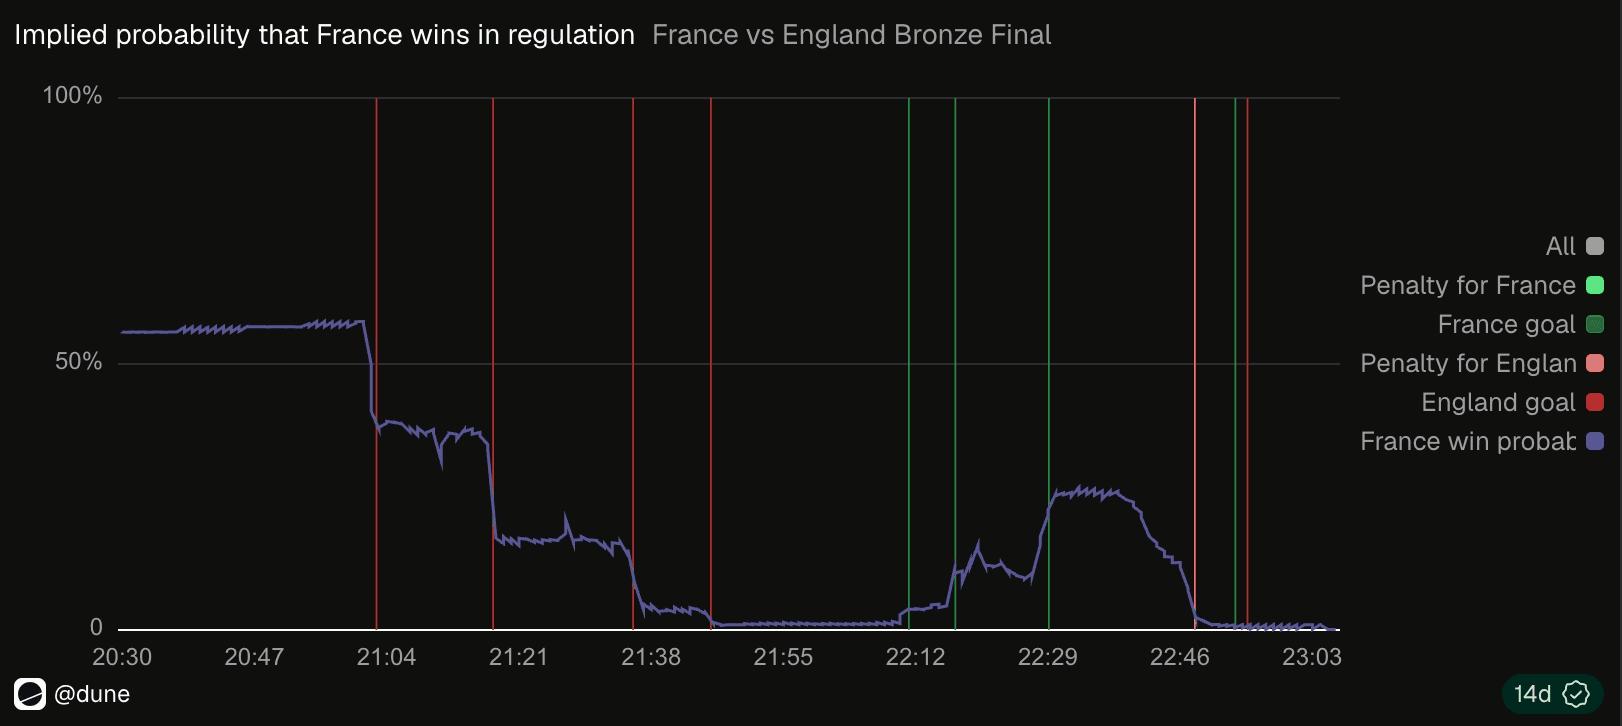
Source: Prediction markets are the real winners of the World Cup, Digital Asset Brief by Dune, Issue 4, Dated: 2026-07-28. Query Source: https://dune.com/queries/8027731/12012950?utm_campaign=visualization&utm_medium=copy&_hsmi=141811820&utm_source=share
A few hundred accounts took the winnings, and a few hundred paid the rake
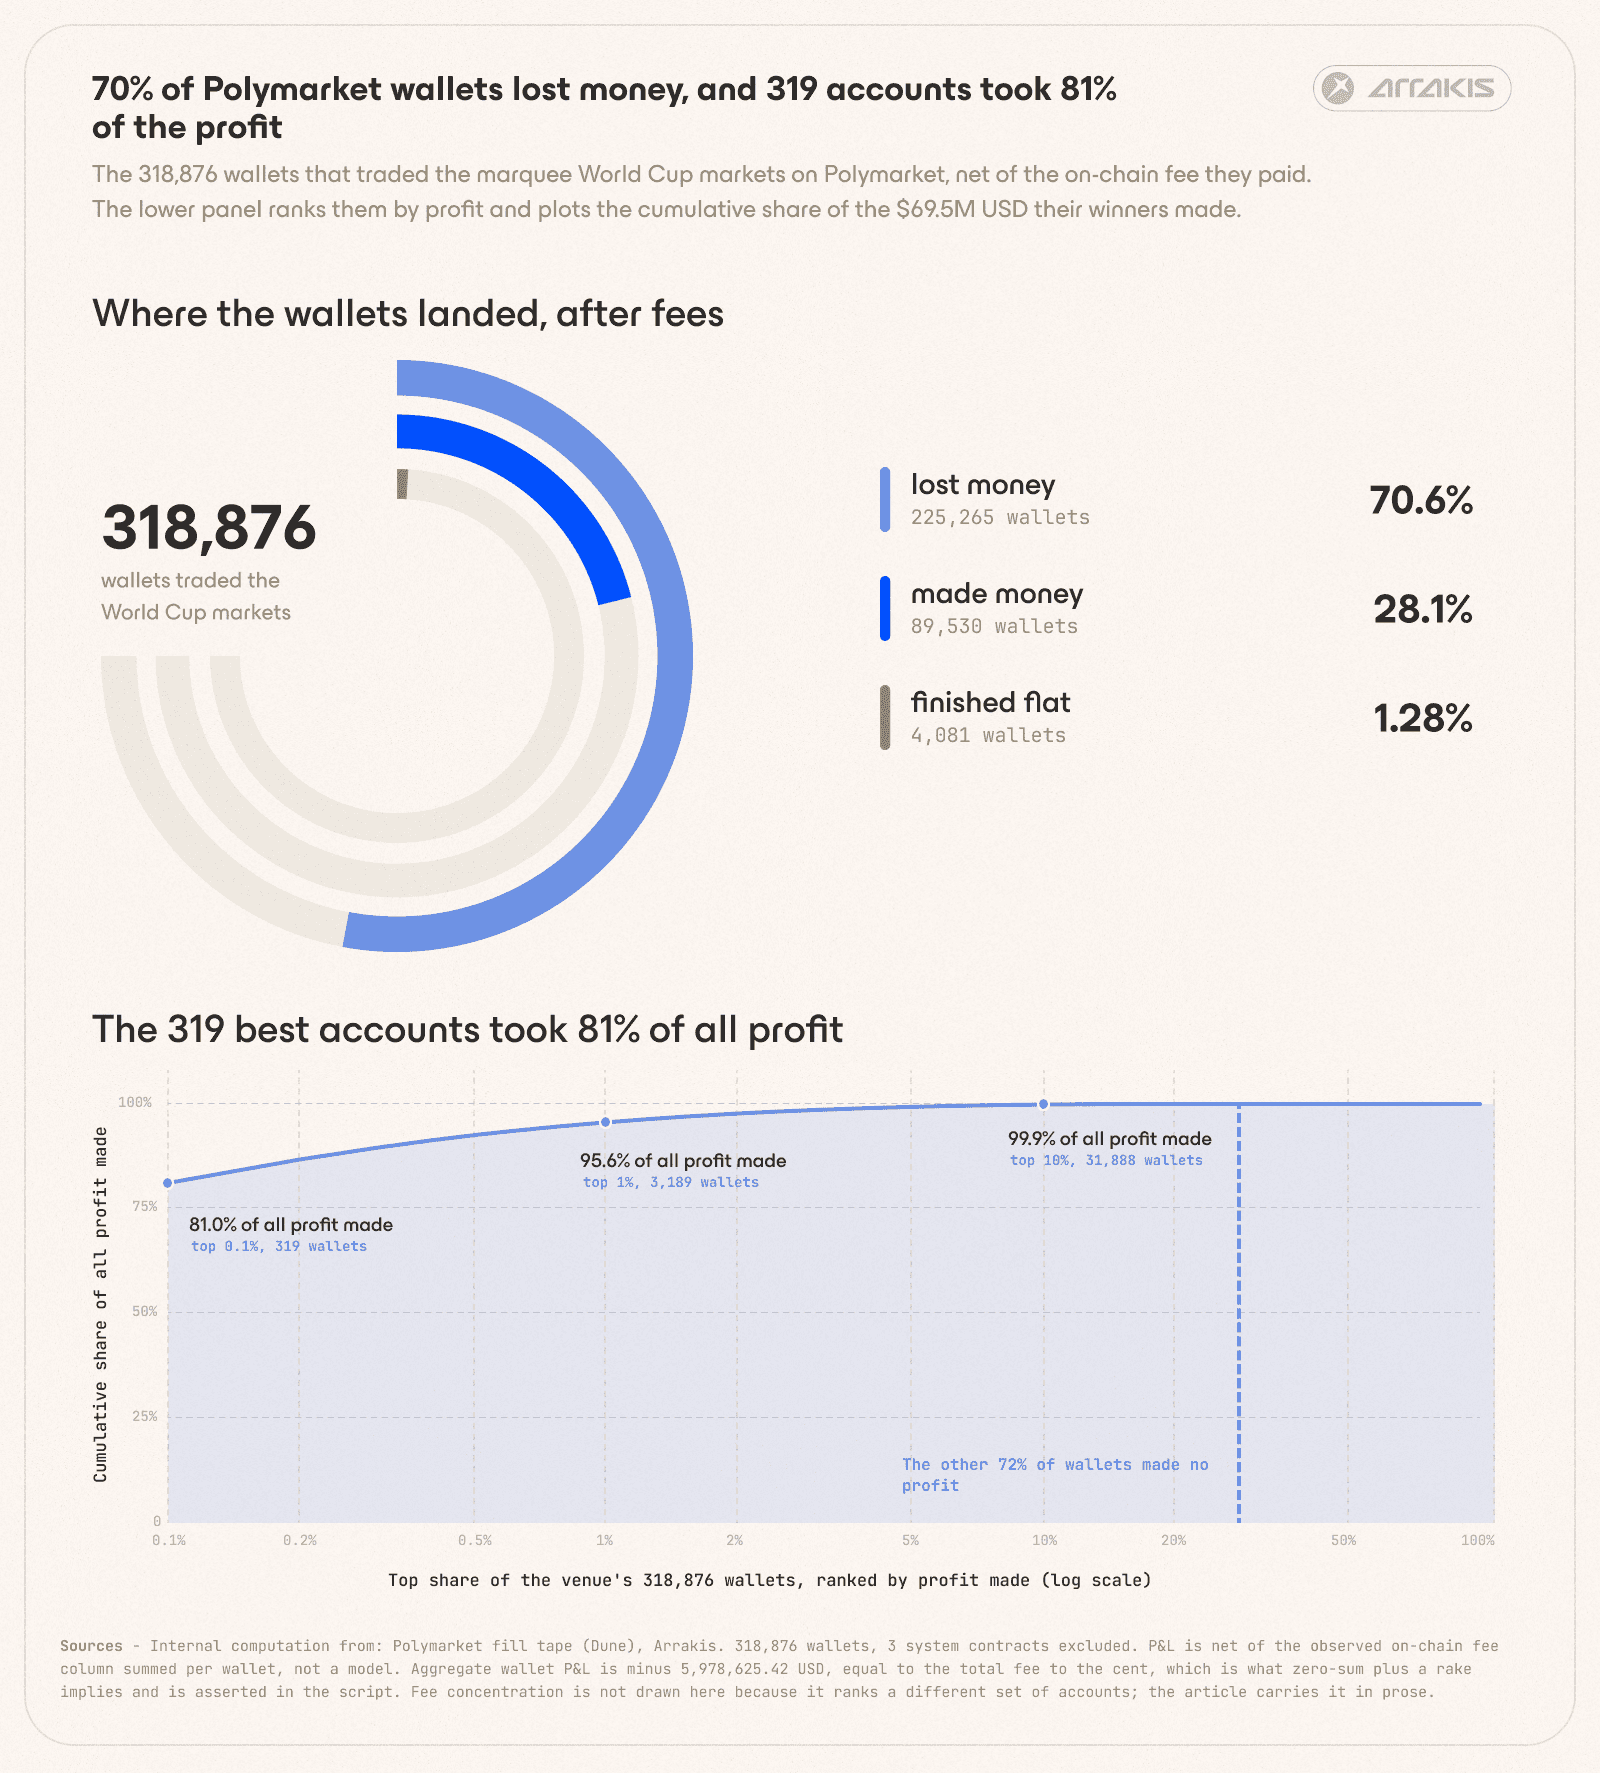
How Polymarket accounts finished, beside how tightly the winnings concentrated. The right pane is a cumulative share of the 69.5 million dollars its winners made.
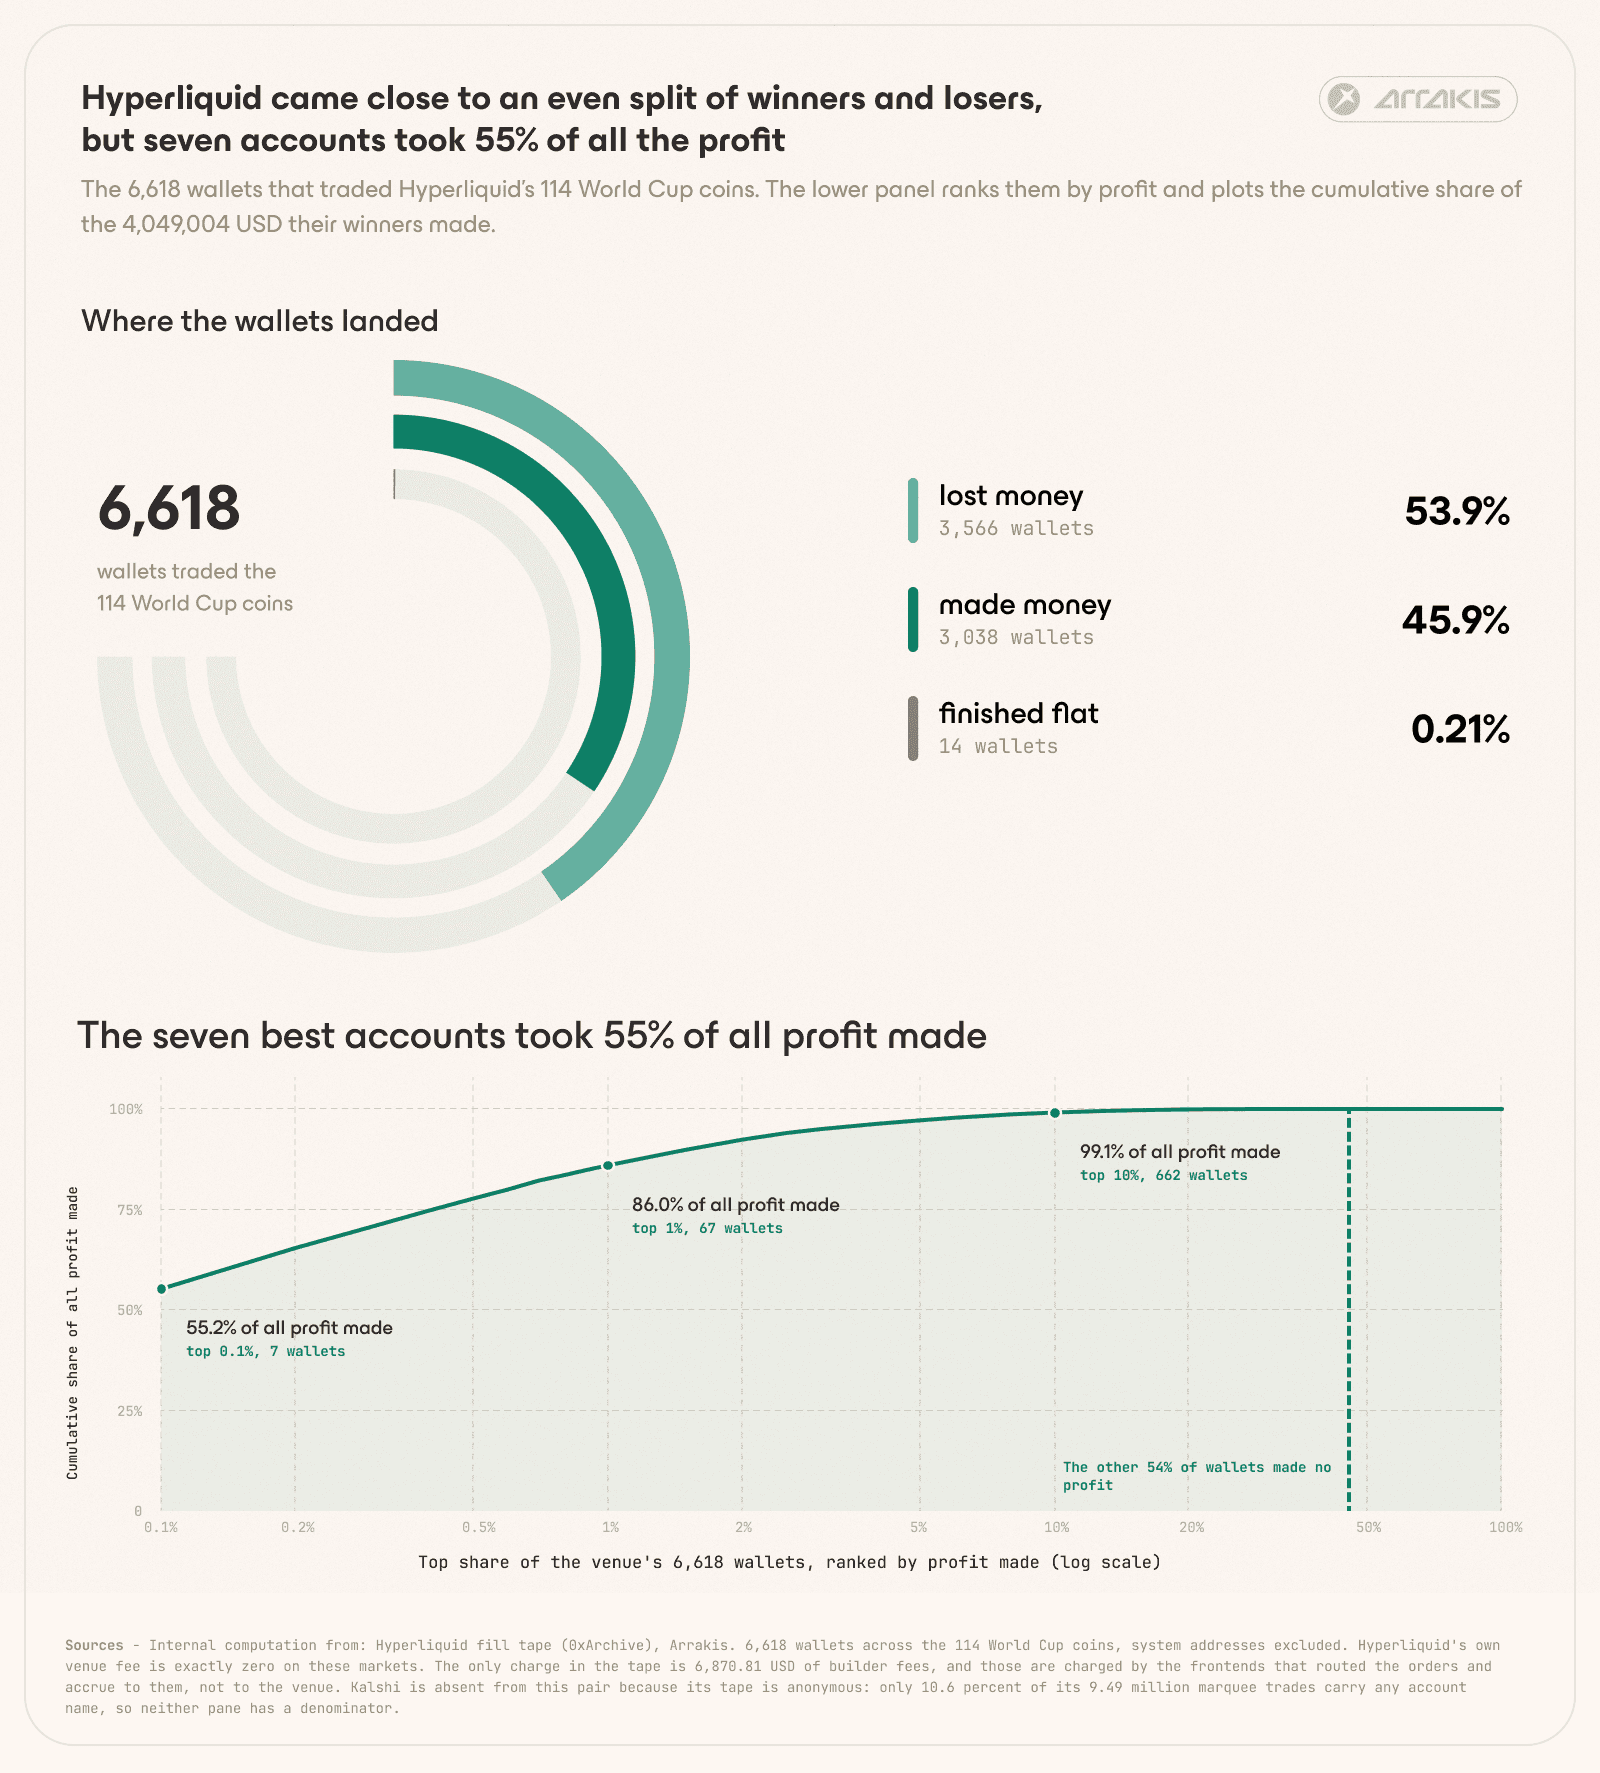
The same distribution for Hyperliquid. Its hundred best accounts took 89.9% of the profit, against Polymarket's 69.5%.
Most accounts bet once, lost, and did not bet again.
Almost all the winnings went to a very small number of profitable traders. Polymarket's hundred best accounts took 69.5% of every dollar of profit made on the venue. On Hyperliquid the top hundred took 89.9%, and seven accounts took 55.2% between them.
The fees the venues collected came from a similarly small group. 319 Polymarket accounts covered 51.7% of every fee dollar the venue's traders paid, and 174 of those 319 finished the tournament in a loss.
Polymarket took bets from a third of a million accounts during the tournament but collected half its fees from a group that would fit in one room.
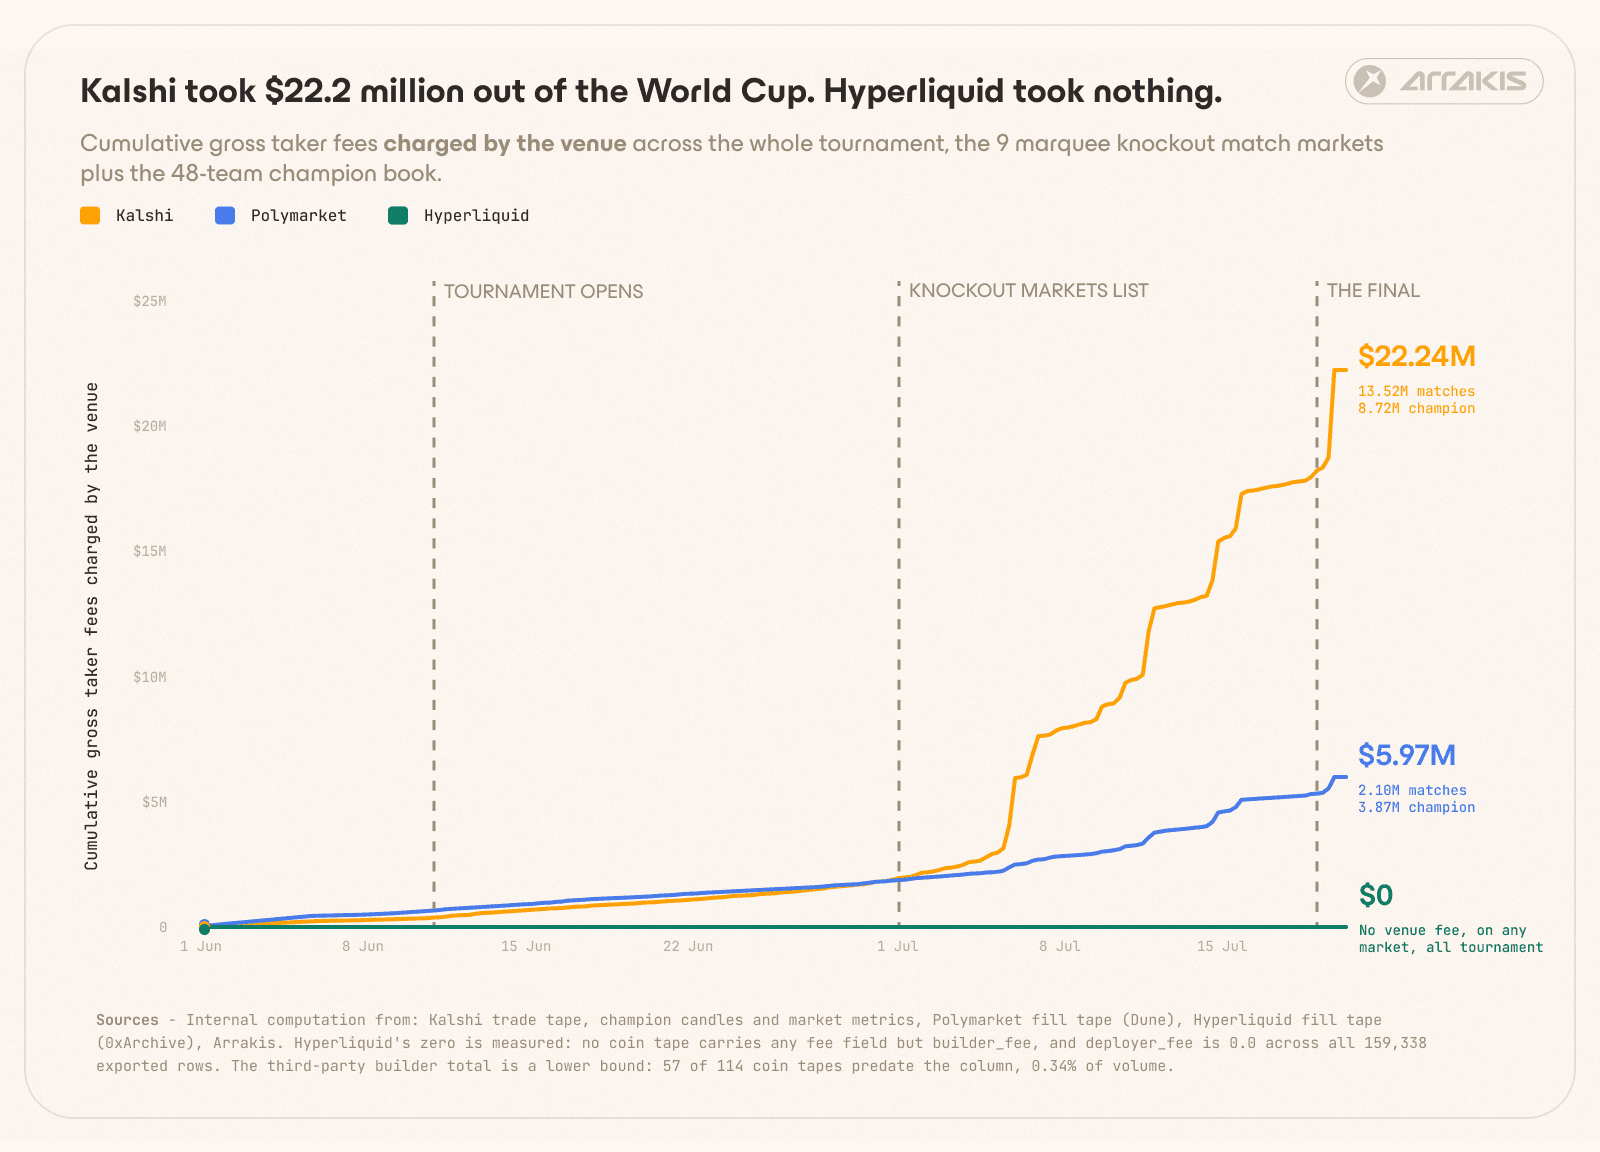
Cumulative fees across the whole tournament. Polymarket's line is observed on chain and Kalshi's is modelled from its published schedule. Polymarket's endpoint is every fee its traders paid, of which $5.83M was the venue's own charge and $153,372 went to routing.
Kalshi collected $22.23M and Polymarket $5.83M across the nine match markets and the champion book, so Kalshi took 3.8 times the fees. Much of that gap is structural. $307M of the $735M on Polymarket's World Cup books ran on its older v1 contracts, which charged no fee at all, so 42% of its volume could never be charged. A further $153,372 on the same Polymarket trades was a routing fee that went to the interfaces sending the orders rather than to the venue.
Fee for both the venues is calculated via this equation.

Where C is the number of contracts, p is the price in dollars and r is the venue's rate. It peaks on a 50 cent contract and falls away to almost nothing at either extreme, so the fee tracks how uncertain the outcome still is.
Where the difference arises is that Kalshi sets r at 0.07, while Polymarket set it at 0.03 and raised it to 0.05 on 10 July.
Kalshi | Polymarket | |
|---|---|---|
Taker rate | 0.07, unchanged all tournament | 0.03 from 28 April, 0.05 from 10 July |
100 contracts at 50 cents | $1.75 | 75c, then $1.25 |
100 contracts at 10 cents | 63c | 27c, then 45c |
Resting side | charged on two of the three World Cup series | rebated |
Hyperliquid charged no venue fees. Apps that integrated the markets made some nominal fees on top of the order flow they routed. $6,870.81 of builder fees in our data went to the interfaces that routed the orders, and none of it reached Hyperliquid.
Did the World Cup attract new users?
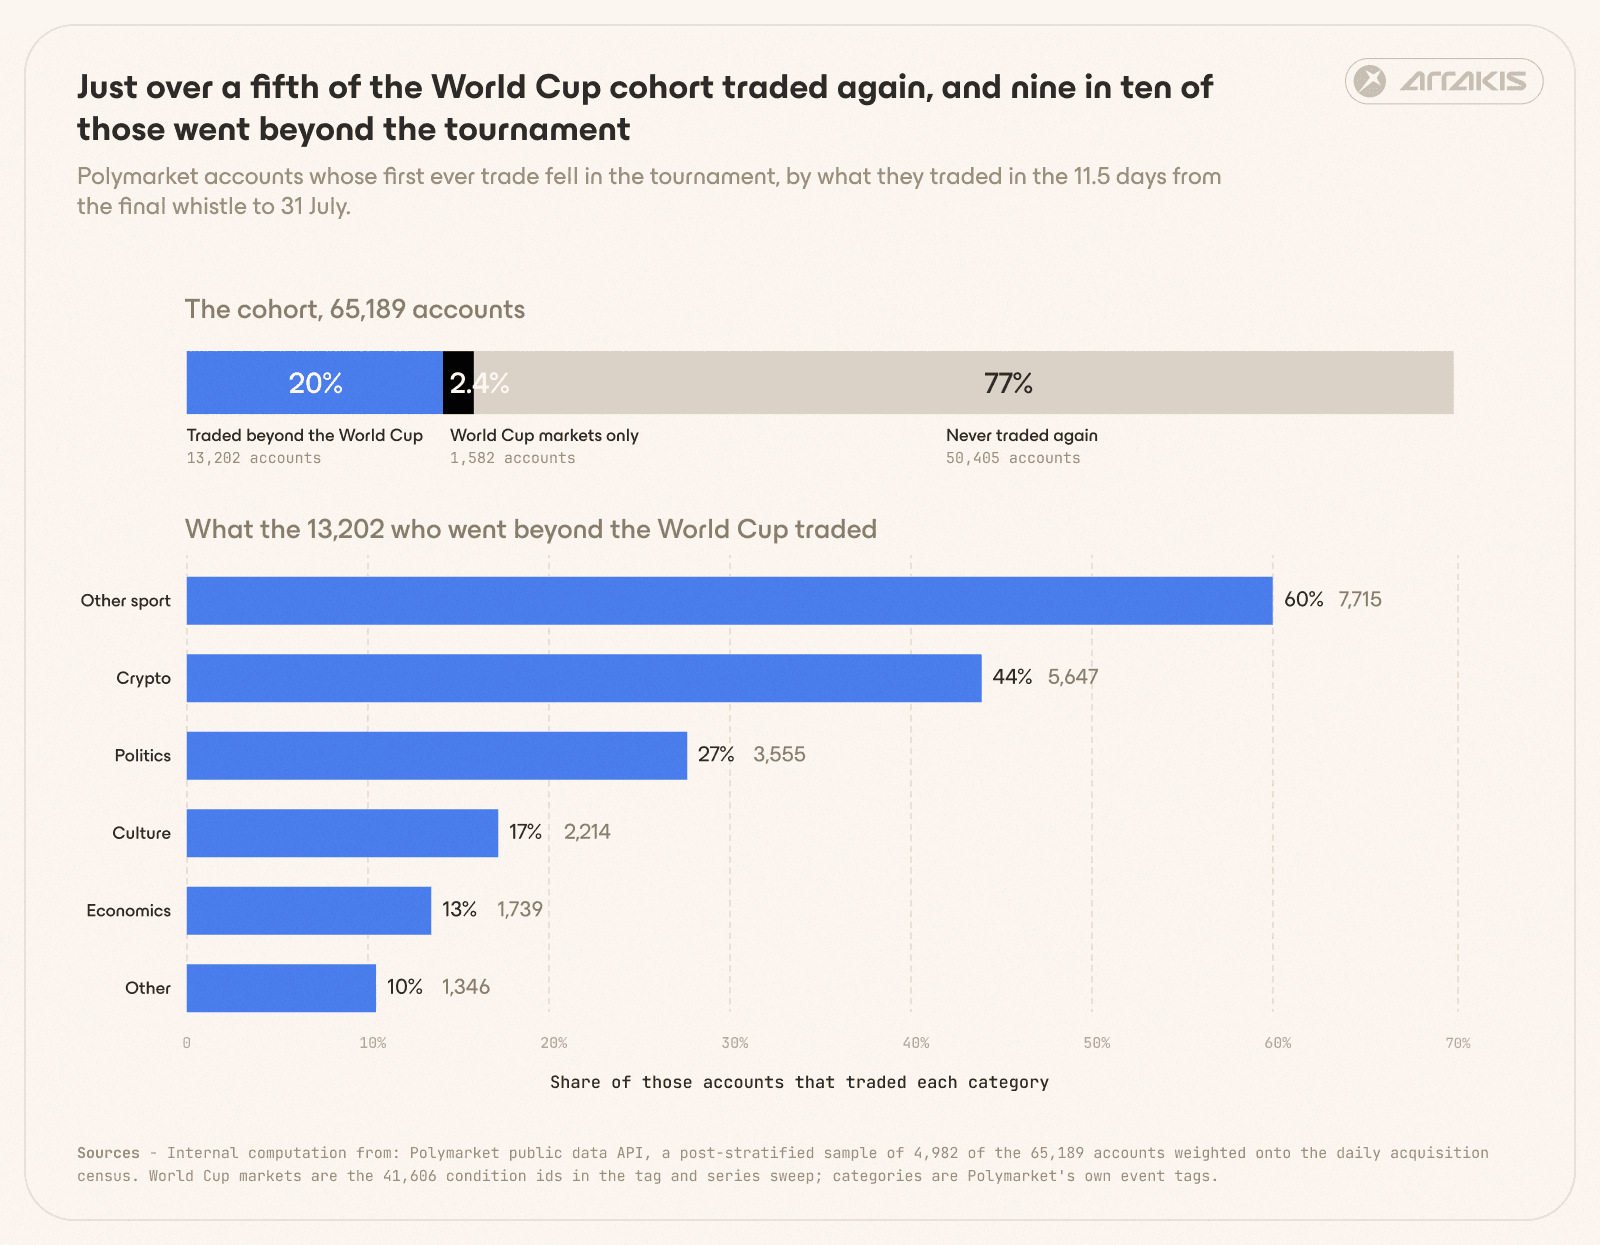
Where the 65,189 accounts Polymarket acquired during the tournament went in the twelve days after the final. The category shares plotted here are weighted sample estimates and run about a point above the same shares worked out from the counts.
Approximately 23% of the 65,189 accounts Polymarket picked up during the tournament traded again in the twelve days following the final whistle, which for a sports-driven acquisition spike is a good outcome. Where the rest went says more than the headline number.
Within twelve days of the final, 14,784 of them had already traded again, and nine in ten of those traded something other than the World Cup. 13,202 accounts, 20.3% of the cohort, placed at least one bet on a market outside the tournament. Another 1,582 came back only for World Cup markets, all of them within a day of the previous match. The remaining 50,405 have not traded since.
Of those 13,202, 58% traded another sport, 43% crypto and 27% politics. Accounts that finished the tournament in profit returned at roughly twice the rate of accounts that finished it down.
Note. The window runs 11.5 days, from full time on 19 July to 31 July, and the returning share was still climbing at the end of it, so each of these figures is a floor rather than a settled retention rate. The three-way split is estimated from a post-stratified sample of the cohort, so the 20.3% carries a range of 19.2 to 21.4%.
Newcomers bet differently from regulars, measured on Polymarket where a new account means somebody's first ever trade on the platform.
Median fill | Fills per account | Account volume | Lost money | |
|---|---|---|---|---|
New | $9 | 2 | $27 | 73.8% |
Established | $1 | 5 | $44 | 69.8% |
A newcomer placed fewer and larger bets while existing traders made smaller but higher number of trades.
Winning stayed just as concentrated among the newcomers. Their top 1% took 92.0% of the cohort's profit, against 86.9% among established accounts.
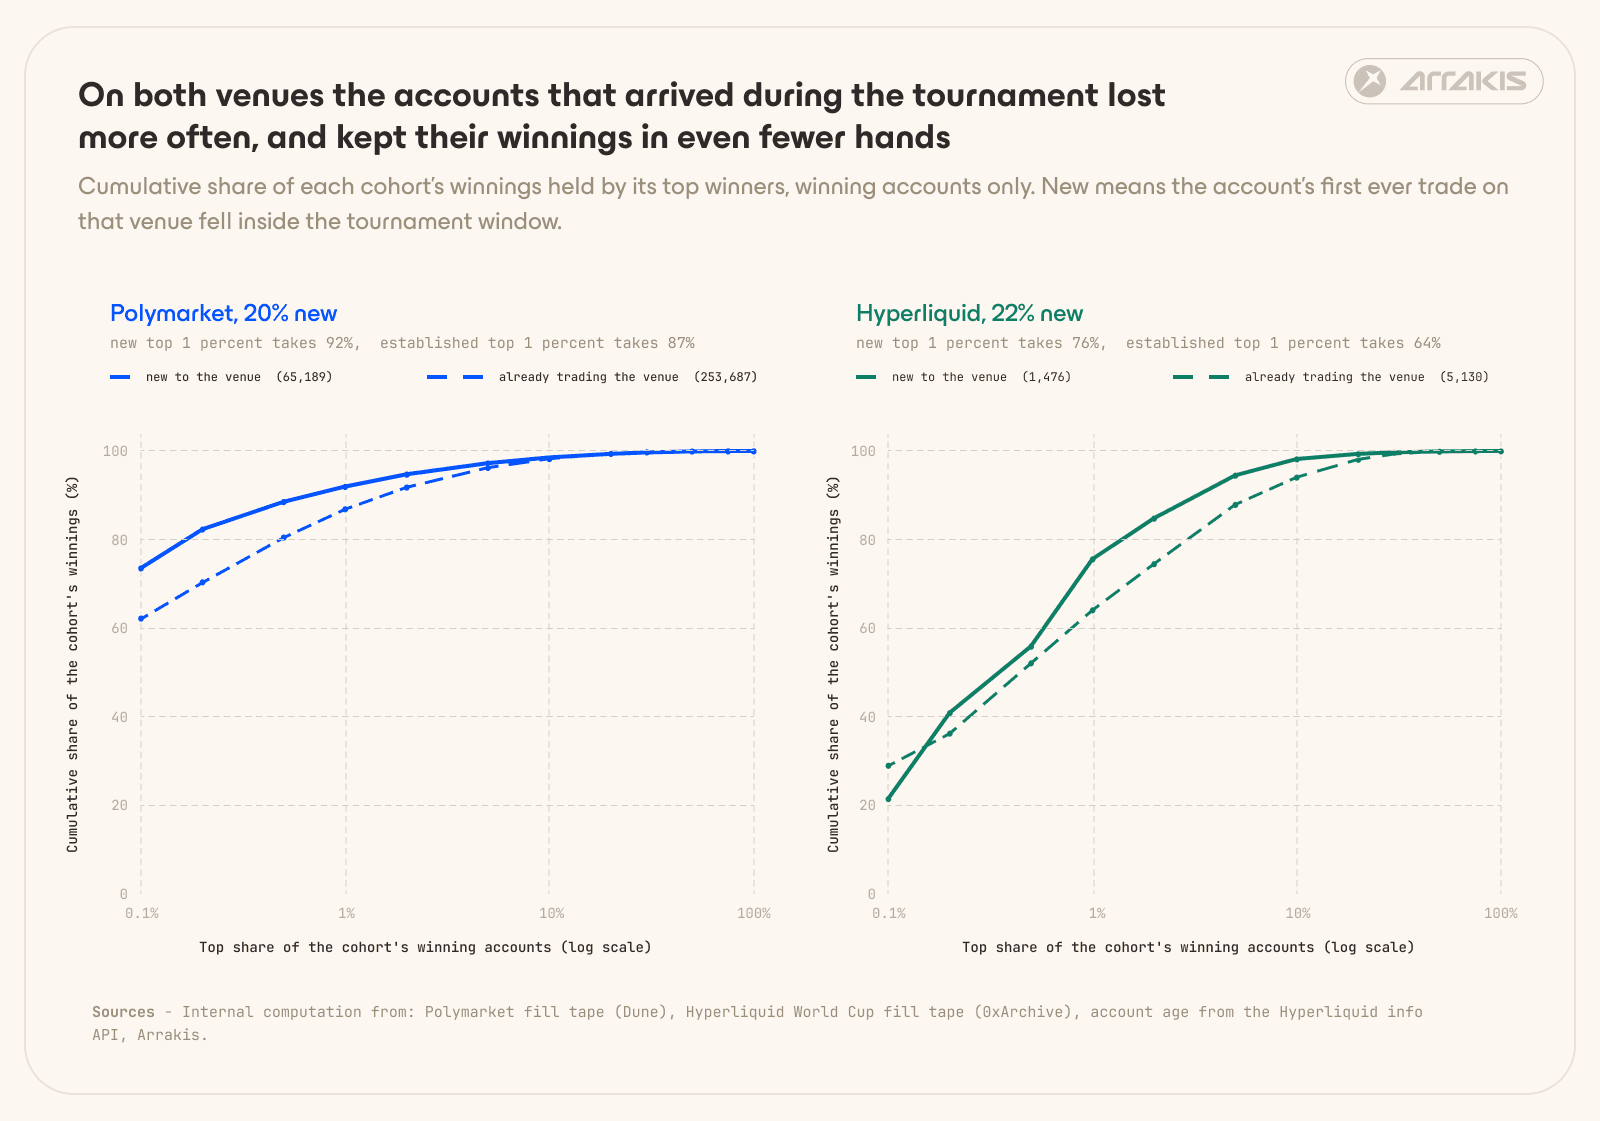
Concentration of winnings, new accounts against established, on both venues. Winning accounts only.
More than three quarters of the accounts trading Hyperliquid's World Cup markets were already Hyperliquid customers. Each account is dated by its first trade anywhere on the venue instead of its first trade on a football market.
Share | Accounts | |
|---|---|---|
Already trading Hyperliquid before 11 June | 77.5% | 5,130 |
First traded on Hyperliquid during the tournament | 22.3% | 1,476 |
Could not be dated | 0.2% | 12 |
Of the fifth who did arrive during the tournament, fewer than half came in for the football market at all. The rest turned up to trade BTC, HYPE and SOL, so the football brought in about one in ten of the 6,618 accounts that traded these markets.
Liquidity per venue
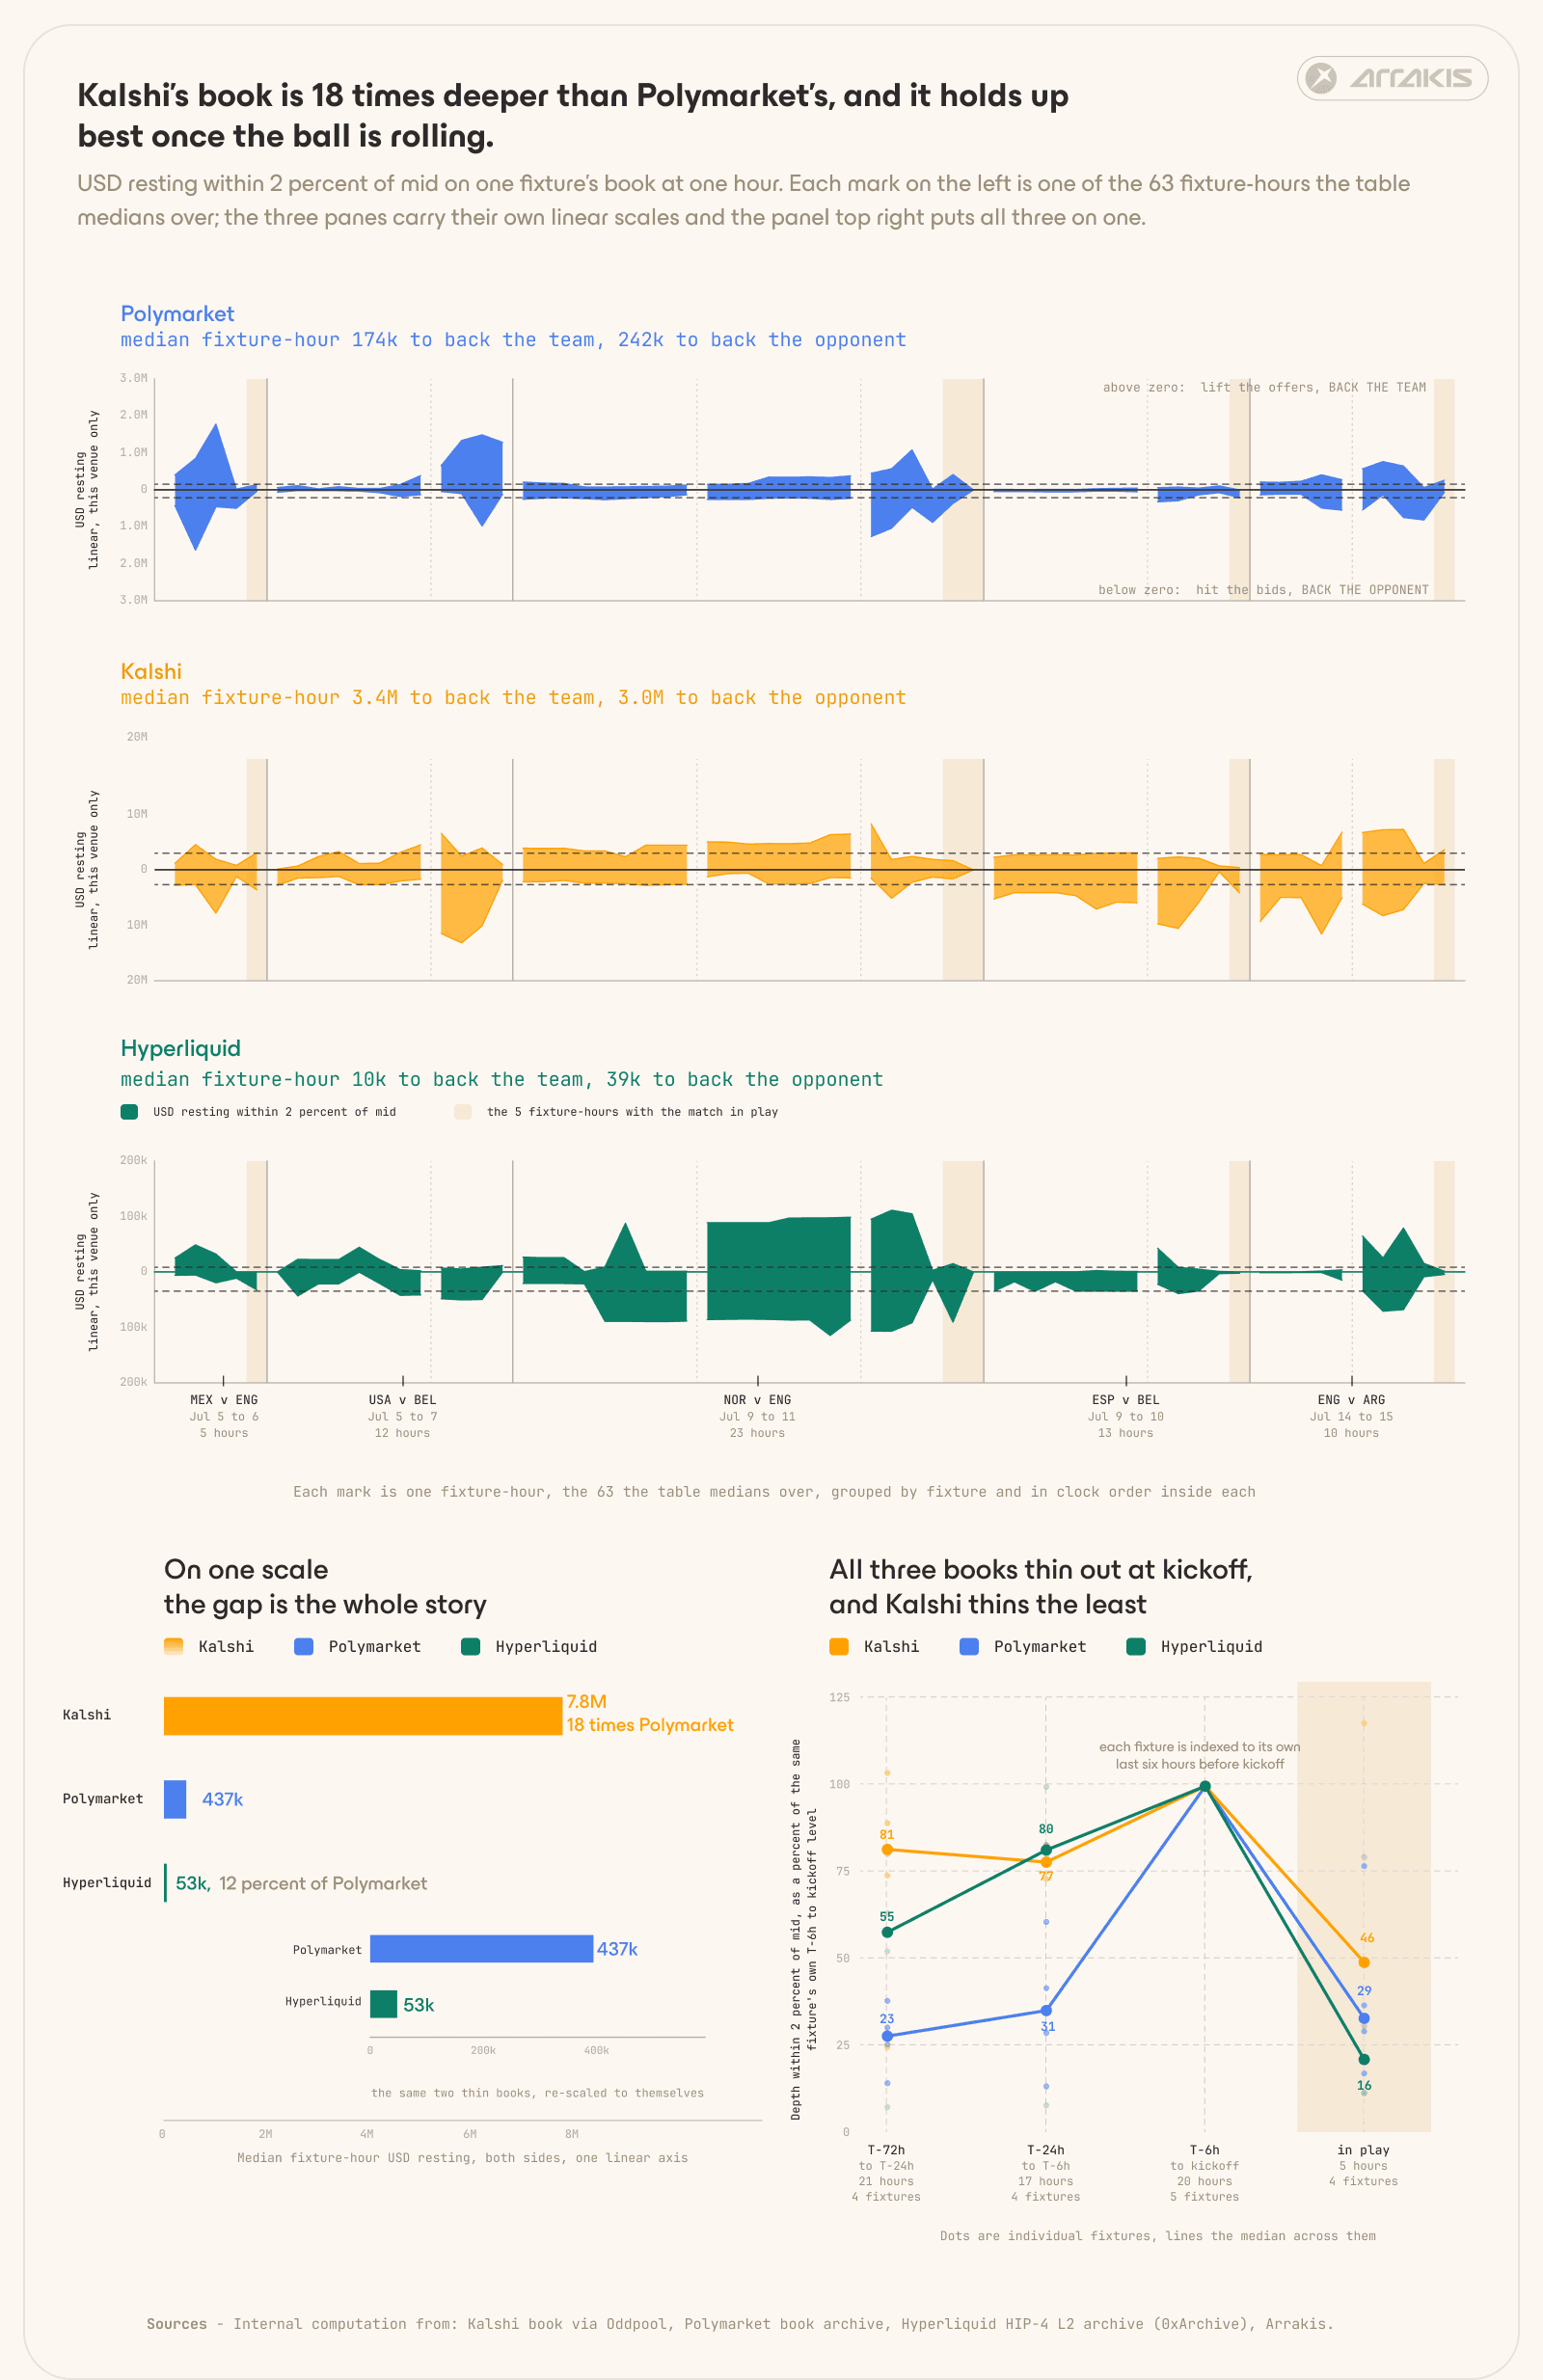
Resting depth by venue, in dollars within 2% of mid. Kalshi is the deepest book on every fixture, at a median 18 times Polymarket. Hyperliquid is the thinnest, at 12% of Polymarket.
Median USD resting within 2% of mid, per fixture-hour.
Back the team | Back the opponent | Both sides | |
|---|---|---|---|
Kalshi | $3.4M | $3.0M | $7.8M |
Polymarket | $174k | $242k | $437k |
Hyperliquid | $10k | $39k | $53k |
Kalshi consistently had the deepest market of the three venues with nearly all of the liquidity at the best bid and ask level. Even still, Polymarket traders experienced less slippage on a median spread of a quarter of a cent against Kalshi’s 1 cent.
Across the five fixtures with order book coverage, Kalshi's median depth was 18 times Polymarket's.
Hyperliquid quoted the finest prices on the match markets, a median spread of 0.198 cents against Polymarket's 0.25 and Kalshi's 1. That ordering is specific to these fixtures. On the champion outright both Kalshi and Polymarket quote a tenth of a cent and Hyperliquid is the widest of the three.
Hyperliquid had relatively sparse market depth backing the best bid and ask levels. Its median book held about 12% of Polymarket's liquidity at 2% of mid and less than a hundredth of Kalshi's, so anyone trading real size there had to accept that the book might not hold enough to let them exit cleanly when they wanted to.

Fill rate and cost by venue at three order sizes. Kalshi fills every order at a flat cost, and Polymarket is cheaper than both at every size. Hyperliquid quotes the finest price of the three but has depth to fill 100k in only one hour out of three. Each cost counts only the hours that filled at that size, so on the hours where all three fill 100k Polymarket costs 19 basis points against Hyperliquid's 63.
All three venues saw liquidity thinning at kick off but by different levels. Measured against their own last six hours before kickoff, Kalshi keeps 46% of the depth it had, Polymarket 29% and Hyperliquid only 16%.
So the three venues optimised for different things. Kalshi provided certainty of execution at a fixed price, Polymarket offered the cheapest fill, and Hyperliquid promised the finest quote albeit on the smallest book.
Conclusion
Prediction markets came to this tournament far bigger than they were a year ago. The whole category traded under $1B a month through the first half of 2025. July 2026 was $17.4B, its largest month on record, driven by the World Cup volume.
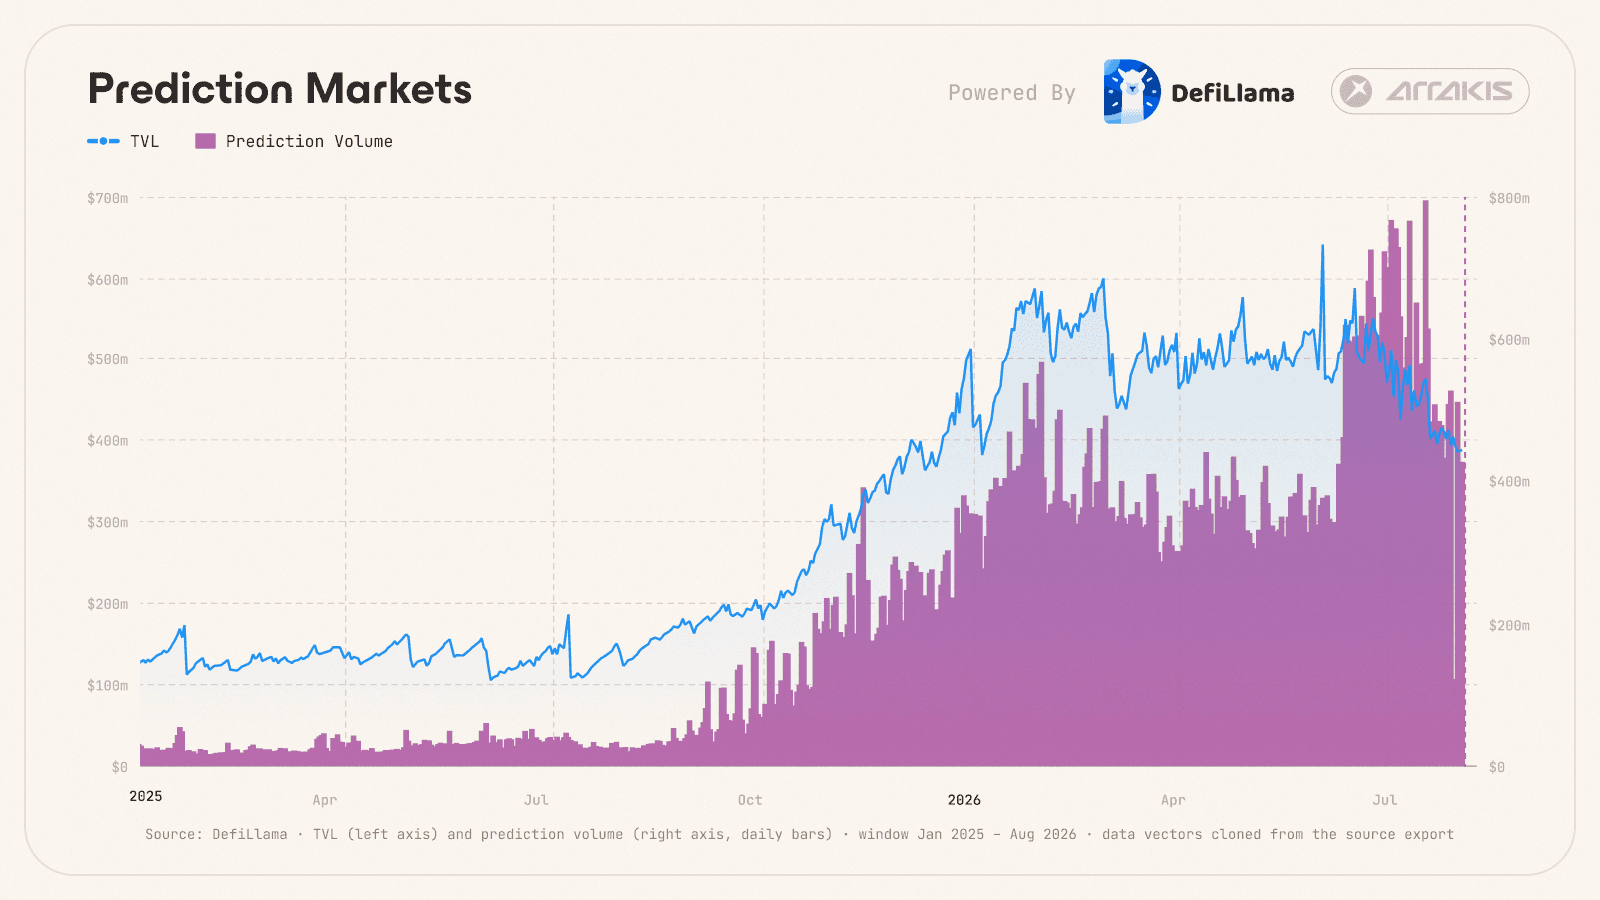
Category volume for prediction markets on DefiLlama, read 31 July 2026. July holds 30 days of data, so its total is a floor rather than a full month.
Beyond the scale, these markets proved to be impressively accurate. Traders had France marked down before a penalty was even announced, and three venues built on entirely different machinery landed on nearly the same odds across the matches.
June and July were the two biggest months this category has ever had. What the tapes show underneath that growth is a market with the participation of a consumer product and the economics of a professional one: a third of a million accounts on Polymarket alone, seven in ten of them finishing down, and a few hundred supplying both the profit and the rake.