Research
Deep Dive
Hyperliquid


An analysis of orderflow across seven HIP-3 perpetual markets on Hyperliquid, 175,000 wallets, $161B in volume, and the frontends routing it all.
This article is published for informational and educational purposes only and does not constitute investment advice. Arrakis has made reasonable efforts to verify the accuracy of the data presented but does not warrant that all information is accurate, complete, or current.
Thank you to our contributors 0xArchive and HyperTracker (by Coin Market Manager) for powering the data behind this research.
Abstract
We analysed 175,703 wallets and $161.4B in trading volume across 7 HIP-3 perpetual markets on Hyperliquid. The markets covered oil (CL), silver (4 deployers), equities (TSLA), and index (XYZ100). Using a two-layer classification that combined fills-based statistical labelling with 808M order events across 21 days of market data, we classified wallets into: Market Maker, Stat Arb Taker or Retail.
Of the total volume, 11.8% came from market making adresses, 12.8% retail, 4.2% stat arb, and the remaining 71.2% was unclassified.
A third-party frontend ecosystem has formed on top of HIP-3, with wallet providers, consumer trading apps, and algorithmic routing products all competing for order flow. When traditional markets closed on weekends, retail's share of volume doubled from 12% to 28%, as Hyperliquid established itself as the only live price discovery venue for these markets.
Seven Markets, $161 Billion, 175,000 Wallets
HIP-3 markets are permissionless perpetual futures deployed on Hyperliquid by third-party teams. Any team with 500K HYPE staked can deploy these markets. We studied seven of these markets to analyse whether onchain trading data could tell us more about who was participating and how.
We analysed four trade.xyz markets: xyz_SILVER ($78.6B in total volume), xyz_XYZ100 ($40.1B), xyz_CL ($34.1B), and xyz_TSLA ($2.2B). We also analysed one silver market from each of three other deployers: Dreamcash with cash_SILVER ($3.2B), Felix with flx_SILVER ($2.8B), and Kinetiq with km_SILVER ($541M).
Our fills data spanned each market's full history (December 2025 to March 2026). Order lifecycle data covered March 10 to 31, 2026: 21 days, 808 million order lifecycle events across all markets.
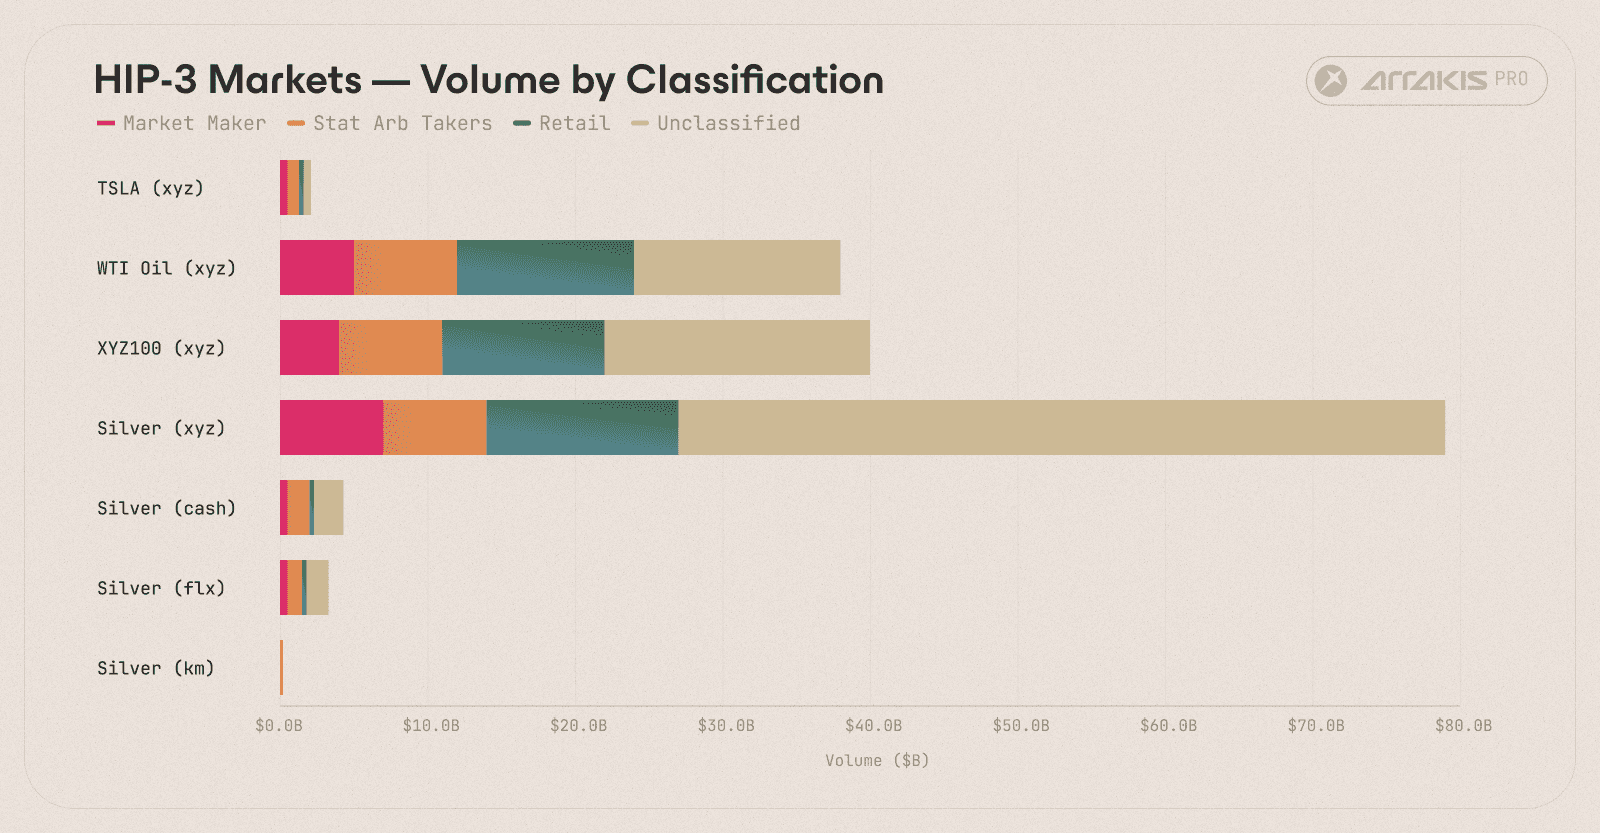
Figure 1. Stacked bars showing volume breakdown by trader category for each HIP-3 market. Unclassified volume (grey) dominated every market; xyz_SILVER alone accounted for $78.6B.
Note on Methodology
We used a two-layer classifier to label each wallet. Layer 1 applied statistical gates to fills data, maker/taker ratios, fill frequency, temporal clustering, and orderbook cancellation rates. Layer 2 used order lifecycle metadata, time-in-force flags (FrontendMarket for retail, IOC for bots) and builder tags, to catch wallets the statistical layer missed.
The Full Picture
Category | Wallets | % | Volume | % |
|---|---|---|---|---|
Market Maker | 2,016 | 1.1% | $19.1B | 11.8% |
Retail | 50,477 | 28.4% | $20.7B | 12.8% |
Stat Arb Taker | 2,935 | 1.7% | $6.7B | 4.2% |
Unclassified | 122,163 | 68.8% | $115.1B | 71.2% |
Total | 177,591 | $161.6B |
Full classification results across all 7 HIP-3 markets. MMs and stat arb takers represented 2.8% of wallets but 16% of volume; retail was the inverse, 28.4% of wallets, 12.8% of volume.
71.2% of volume was unclassified. These wallets failed both the statistical and mechanical filters. The bucket could include API bots with mixed maker/taker ratios, wallets active for too few days, and retail who only placed limit orders on the UI. We could not split it further without additional data.

Figure 2. Aggregate volume across all 7 markets classified by Market makers, stat arb takers, and retail.
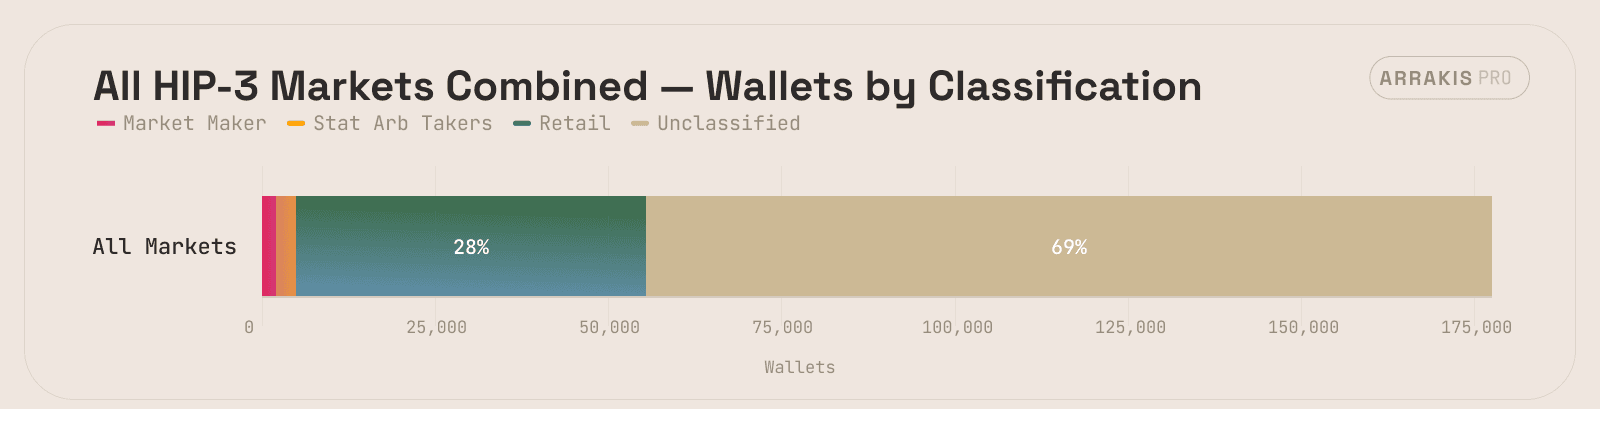
Figure 3. Wallet count by category.
The Frontend Ecosystem
The builder tag data revealed a third-party frontend aggregation layer forming on top of HIP-3.
Builder Taxonomy
We could attribute each builder into one of five categories: wallets with native perps trading, consumer trading apps, deployer's own frontend, algorithmic routing products, or the Hyperliquid native frontend. Builder tags helped us trace the first four and FrontendMarket TIF identified the fifth.
Builder identification was done with HyperTracker by Coinmarketman, which tracks builder activity, fee structures, and order routing across the Hyperliquid ecosystem. Unlabeled builders were cross-referenced via Hypurrscan.
"We added dedicated builder tracking to HyperTracker to make sense of the builder landscape on Hyperliquid. What we're seeing on HIP-3 is an orderflow economy forming in real time, independent teams building distribution across permissionless markets."
- David Kanzen, Co-Founder, Coinmarketman (𝕏)
Top 30 builders by routed volume:
Rank | Builder | Routed Volume | Wallets | Fee (bp) | Type |
|---|---|---|---|---|---|
1 | TreadFi | $1.19B | 555 | 2.0 | Algorithmic Product |
2 | Phantom | $867M | 6,569 | 0.1-5.0 | Wallet |
3 | Based One X | $579M | 510 | 0-10.0 | Consumer App |
4 | Dreamcash | $568M | 1,278 | 0-4.5 | Deployer Frontend |
5 | $439M | 154 | 1.5 | -- | |
6 | $417M | 5 | 1.0 | Algorithmic Product | |
7 | Insilico Terminal | $394M | 183 | 1.0 | Algorithmic Product |
8 | Rabby Perps | $273M | 828 | 2.0 | Wallet |
9 | $209M | 34 | 0.5-0.9 | -- | |
10 | MetaMask Perps | $206M | 1,610 | 10.0 | Wallet |
11 | $167M | 210 | 2.0-4.0 | -- | |
12 | Felix HYPE Buyback | $121M | 12 | 0 | Deployer Frontend |
13 | $110M | 9 | 1.0 | -- | |
14 | Hyperdash | $97M | 217 | 1.4-5.0 | Consumer App |
15 | $62M | 4,147 | 5.0 | -- | |
16 | Pear Protocol | $50M | 111 | 6.0 | Consumer App |
17 | OneKey Perps | $48M | 157 | 0-4.0 | Wallet |
18 | DefiApp | $32M | 92 | 2.5-5.0 | Consumer App |
19 | $32M | 41 | 2.6-4.0 | Consumer App | |
20 | Liquid Perps | $32M | 626 | 0-5.0 | Consumer App |
21 | $29M | 29 | 2.0 | -- | |
22 | $28M | 29 | 1.0 | -- | |
23 | $27M | 19 | 10.0 | -- | |
24 | $26M | 68 | 0-3.5 | Deployer Frontend | |
25 | $26M | 34 | 1.5-5.0 | -- | |
26 | $25M | 318 | 1.0-5.0 | -- | |
27 | Planemo Trading | $21M | 44 | 0.1-1.0 | Algorithmic Product |
28 | Infinex | $16M | 42 | 5.0 | Consumer App |
29 | Origami Tech | $15M | 4 | 1.0-2.0 | Algorithmic Product |
30 | Rainbow | $15M | 163 | 5.0 | Wallet |
Wallets (Phantom, MetaMask), consumer apps (Based One X, Hyperdash), algorithmic products (TreadFi, Velo), and deployer frontends each represented distinct routing channels with different fee structures and wallet counts.
Wallets (Phantom, Rabby, MetaMask, OneKey, Rainbow). Wallet providers that have integrated HIP-3 perps trading natively. Phantom led with $867M routed from 6,569 wallets, the widest retail reach of any builder. MetaMask Perps attracted 1,610 wallets and $206M despite charging 10 bp, the highest fee among wallet providers. Rabby routed $273M from 828 wallets at 2 bp. Rainbow and OneKey brought HIP-3 perps access to mobile-first and hardware wallet users respectively.
"Hyperliquid is building the infrastructure to house all of finance onchain. We believe that if we deliver UX that’s on par with products like Robinhood, the key comparison for users then becomes comparing onchain versus the incumbent, offchain equivalent. The breadth of markets and their 24-7 availability made the decision to support HIP-3 markets an obvious decision for us and represents the part of our business we’re most excited about in 2026."
- Alex Laprade, CEO, Rainbow (𝕏)
Consumer Apps (Based One X, Hyperdash, Pear Protocol, pvp.trade, Liquid Perps, DefiApp, Infinex). Standalone trading frontends built on top of Hyperliquid. Based One X led the category at $579M from 510 wallets. Hyperdash followed at $97M from 217 wallets. Fees ranged up to 10 bp.
Deployer Frontends (Dreamcash for cash_SILVER, Felix for flx_SILVER, Markets.xyz for km_SILVER). Each non-xyz deployer operated its own builder address. Dreamcash was the largest deployer frontend by volume ($568M, 1,278 wallets). Trade.xyz did not tag its native frontend.
"Our view has always been that the current crypto-native trading audience represents only a small fraction of the eventual market for onchain trading. Dreamcash was built with that in mind: a frontend-first product designed to make HIP-3 markets easier to discover, easier to trade, and easier to return to. Running our own distribution has reinforced how important product quality and user experience are in unlocking that broader user base."
- Marco van den Heuvel, Co-Founder, Beam (𝕏)
"We believe that the general sphere of crypto traders makes up a fraction of a percent of what the total true market size is, hence our deliberate focus on a pure retail-first trading experience. Kinetiq is also the only operator with stake driven by its community, gated by KNTQ, as well as the only one with public, defined revenue share to stakers and token holders."
- Omnia, Co-Founder, Kinetiq (𝕏)
Algorithmic Products (TreadFi, Insilico Terminal, Velo.xyz, Planemo, Origami). Lower wallet counts, massive order volumes. TreadFi routed the highest volume of any builder ($1.19B) from just 555 wallets, an average of $2.1M per wallet across 11.2 million orders. Insilico Terminal followed at $394M from 183 wallets. Velo.xyz routed $417M from just 5 wallets. These served algorithmic and semi-algorithmic traders.
Hyperliquid Frontend (not a builder). Identified via FrontendMarket TIF represented market orders generated via the native Hyperliquid web UI.
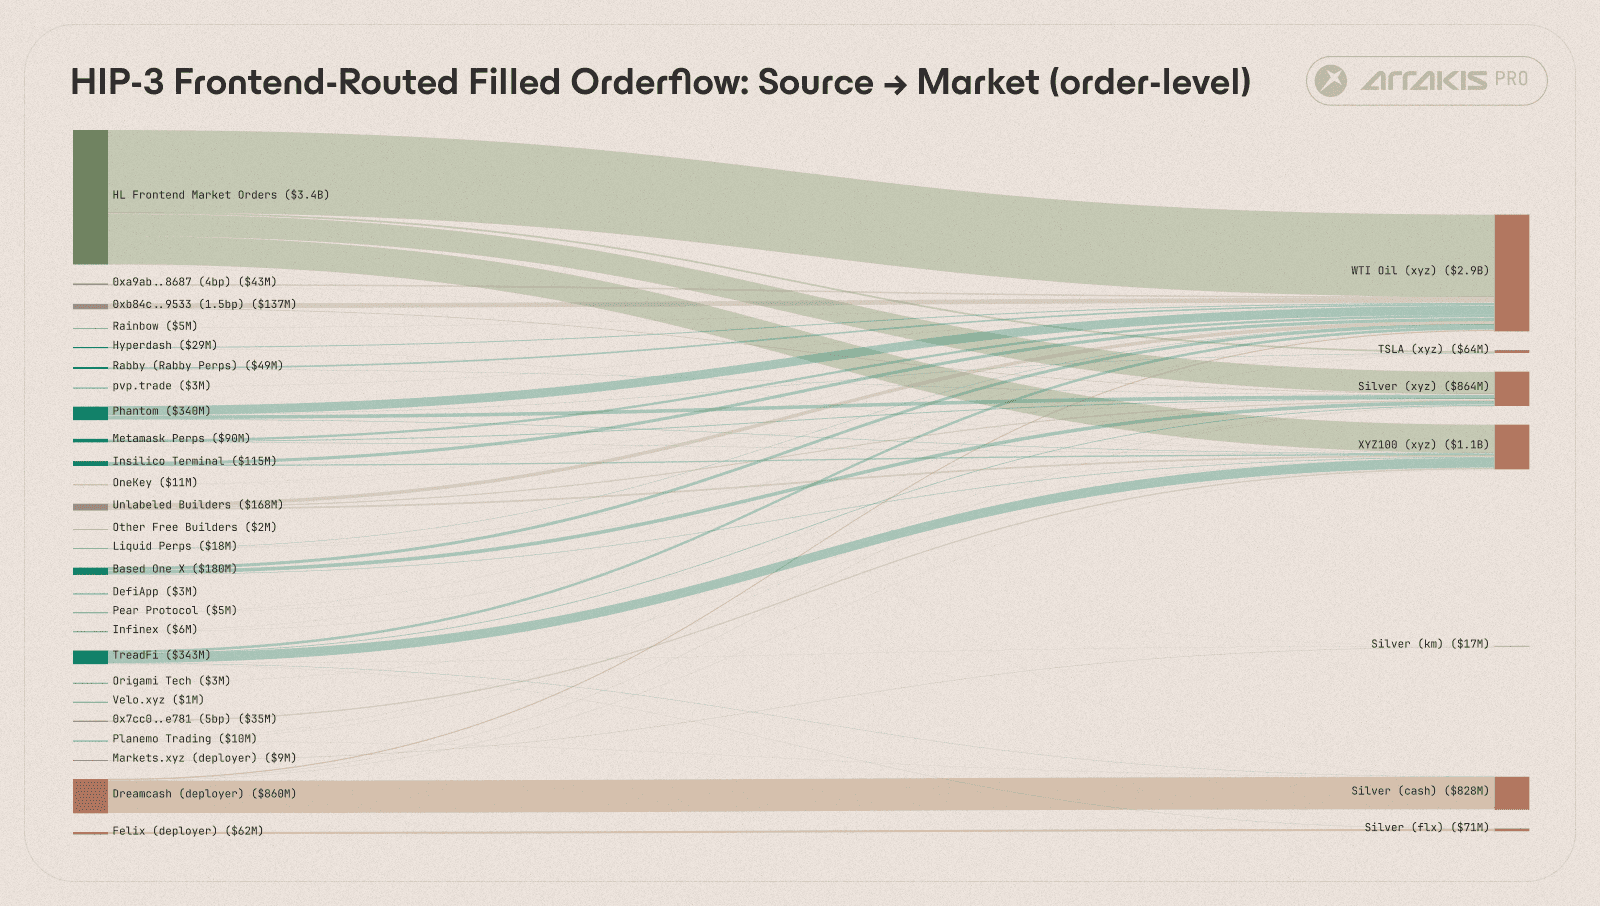
Figure 4. Sankey diagram of order flow routing. Left nodes are submission channels (HL frontend, builders), right nodes are markets. Width represents filled volume. The HL native frontend and Phantom wallet dominated retail flow; TreadFi led algorithmic routing.
Silver Cross-Deployer: Retail and Frontend Origination
Four independent teams deployed silver perpetuals on Hyperliquid, all tracking the same underlying with overlapping user bases. The cross-deployer comparison isolated the effect of deployer infrastructure and community on participant mix.
Market | Total Vol | Retail Vol | Retail % |
|---|---|---|---|
km_SILVER | $541M | $59M | 11.0% |
xyz_SILVER | $78.6B | $5,760M | 7.3% |
cash_SILVER | $3.2B | $113M | 3.5% |
flx_SILVER | $2.8B | $37M | 1.3% |
Note: xyz_SILVER and flx_SILVER retail figures are likely understated, as trade.xyz does not tag its native frontend with a builder code, and Felix's builder serves a fee buyback mechanism rather than retail flow tracking. Retail on these markets is only detected via FrontendMarket (market orders on the HL UI). km_SILVER and cash_SILVER have builder addresses marked for orders originating from their native frontend, making their retail attribution more complete.
Kinetiq (km_SILVER) had the highest retail share by volume (11.0%) despite being the smallest market by total volume. This was consistent with Kinetiq's community-first approach, a higher proportion of its users were trading via frontends and the native UI rather than through API bots.
trade.xyz (xyz_SILVER) was the dominant silver market by an order of magnitude, accounting for $78.6B in volume, more than the other three deployers combined. trade.xyz does not tag its native frontend with a builder code, meaning retail attribution on its markets relies solely on FrontendMarket signals.
Dreamcash (cash_SILVER) was the largest non-xyz silver market by volume ($3.2B) and operated the most active deployer frontend, routing $568M through its own builder address across 1,278 wallets.
Felix (flx_SILVER) ran a distinct model: its HYPE Buyback builder used trading fees to buy back HYPE tokens, creating a direct link between market activity and the Hyperliquid ecosystem.
Deployer infrastructure fingerprints. Fee=0 builder tags on flx, km, and cash all routed to the same wallet (0x3999..3336), a cross-market market maker active on all 7 markets.
Cross-deployer wallets. 2,811 wallets traded silver on 2 or more deployers, and 209 wallets traded all four. Given that the three non-xyz silver markets had 2,258, 2,112, and 1,405 wallets respectively, the cross-deployer overlap was substantial indicating a high degree of cohesion within the HIP-3 ecosystem.
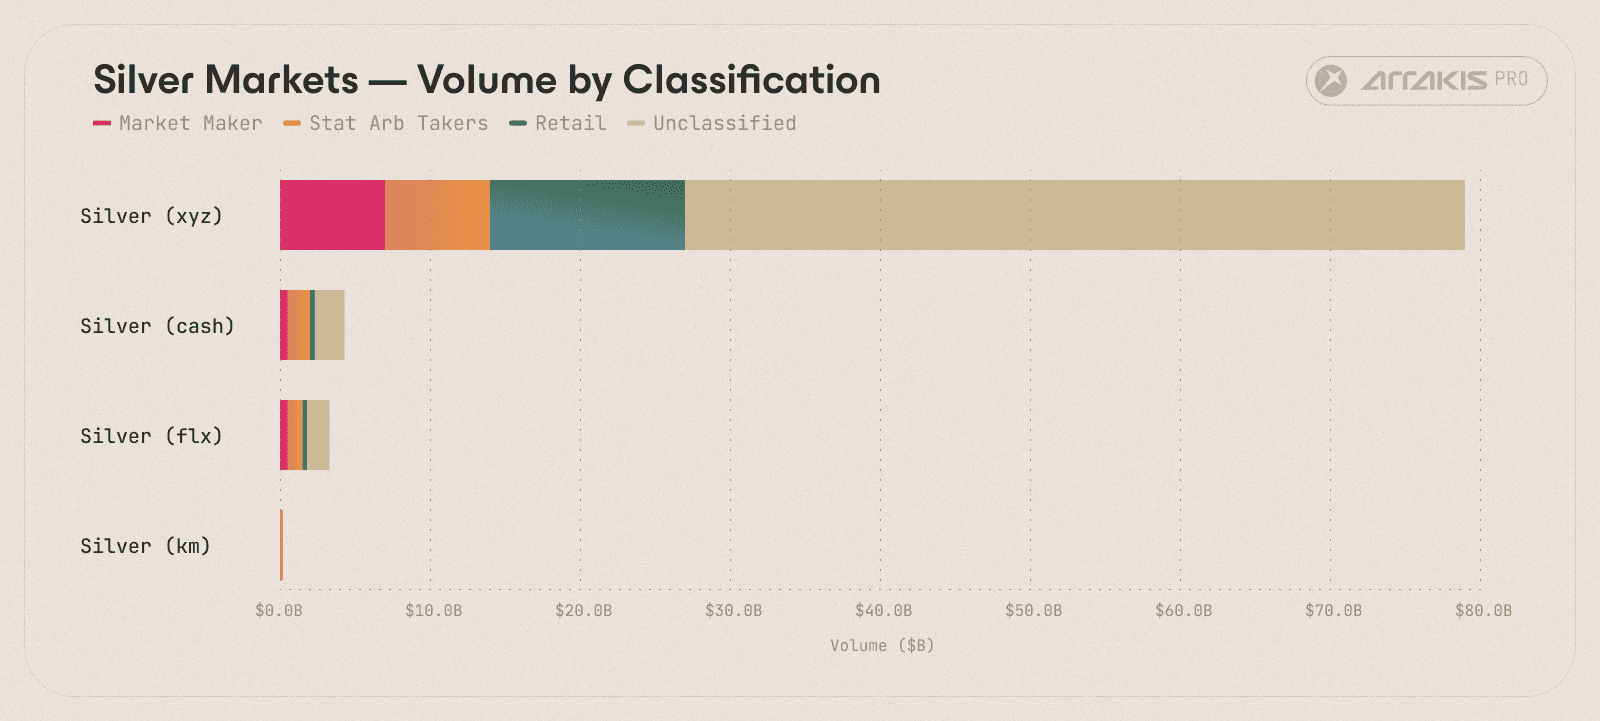
Figure 5. Volume classification across the 4 silver deployers. xyz_SILVER dwarfed the other three combined; the smaller deployers (km, flx, cash) showed distinct category mixes despite trading the same underlying.
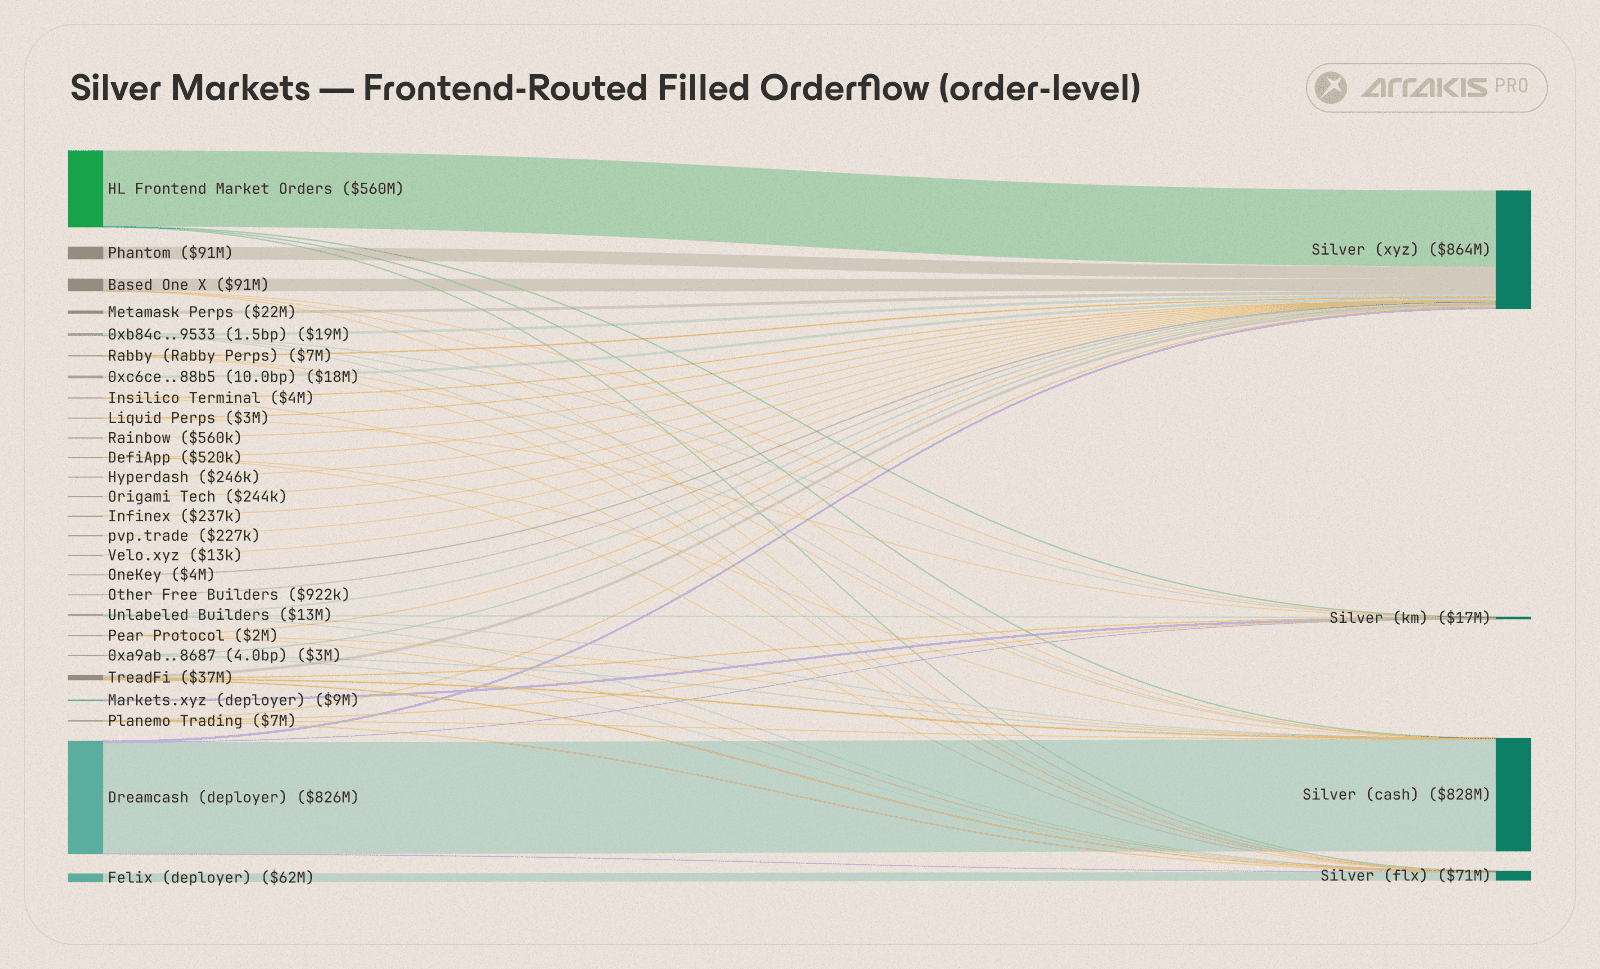
Figure 6. Order flow routing for the 4 silver markets. Each non-xyz deployer operated a dedicated builder address; Dreamcash and Felix routed through their own deployer frontends while xyz flow came through the broader builder ecosystem.
How Each Category Trades
Weekend Effect: Retail Fills the Gap
When CME closes on Friday at 22:00 UTC, HIP-3 markets keep trading, making them the sole price discovery venue for many commodities and indices during weekend hours. This is marked by a clear shift in wallet composition and activity in these markets.
Period | Retail Share | MM Share | SAT Share |
|---|---|---|---|
Weekday (CME open) | 12.1% | 12.1% | 12.5% |
Weekend (CME closed) | 28.4% | 18.4% | 9.2% |
Volume share by category during CME-open vs CME-closed hours. Retail share more than doubled on weekends; stat arb dropped as bots lost their cross-venue reference price.
Within 1-2 hours of CME close, retail's share jumped from 12% to 30%. When CME reopened Sunday 23:00 UTC, it snapped back. This pattern was consistent across all three March weekends in our data (March 14-15, March 21-22, March 28-29).
Stat arb bots largely disappeared on weekends. Their edge depended on cross-venue price dislocations between HIP-3 and CME. When CME closed, there was no external venue to arb against.
Market making persisted, with their share increasing from 12.1% to 18.4%. The increasing retail flow and reduced adverse selection from arbitrage bots made the conditions attractive for a market maker.
Hyperliquid is establishing itself as the venue for real-world asset exposure when traditional financial markets are closed.
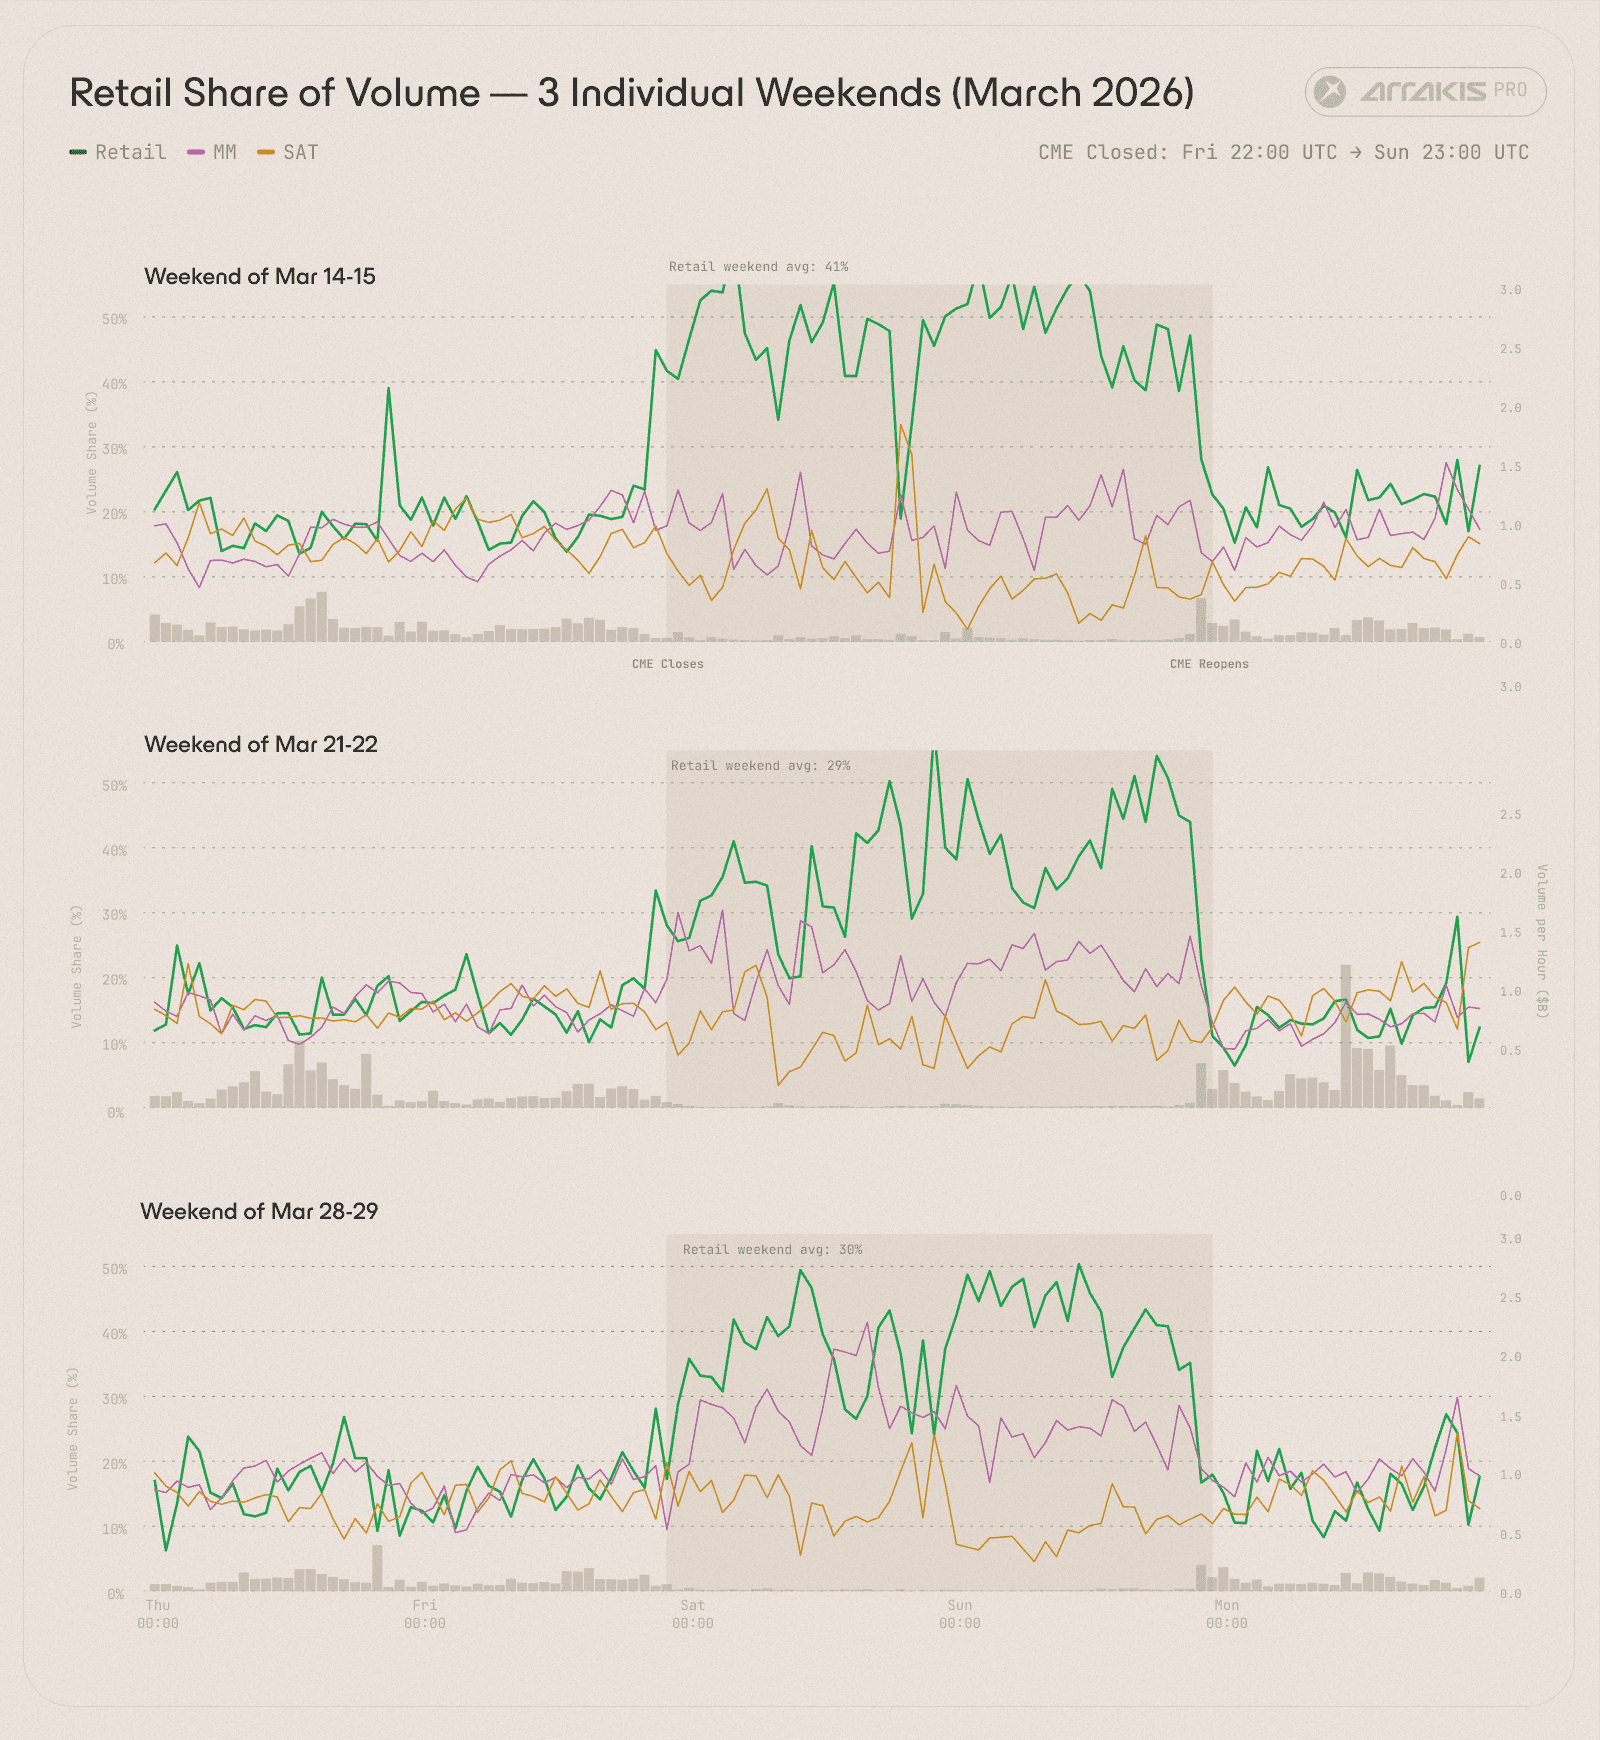
Figure 7. Hourly volume share by category across 3 March weekends. Red shading marks CME-closed hours. Retail share (green) spiked to 30-45% each weekend while stat arb (red) dropped near zero. The pattern repeated consistently.
Hold Time Hierarchy
Median position hold time cleanly separated the trader categories.
Category | Median Hold | IQR |
|---|---|---|
Market Maker | 2.4 min | [1.1, 5.9] min |
Stat Arb Takers | 27.6 min | [5.9, 124.8] min |
Retail | 83.1 min (1.4 hr) | [34.6, 615.4] min |
Unclassified | 74.5 min (1.2 hr) | [11.7, 563.9] min |
The median MM held a position for 2.4 minutes. Stat arb takers held for 28 minutes. Expectedly, retail sat with positions for over an hour, indicating the directional nature of their trades.
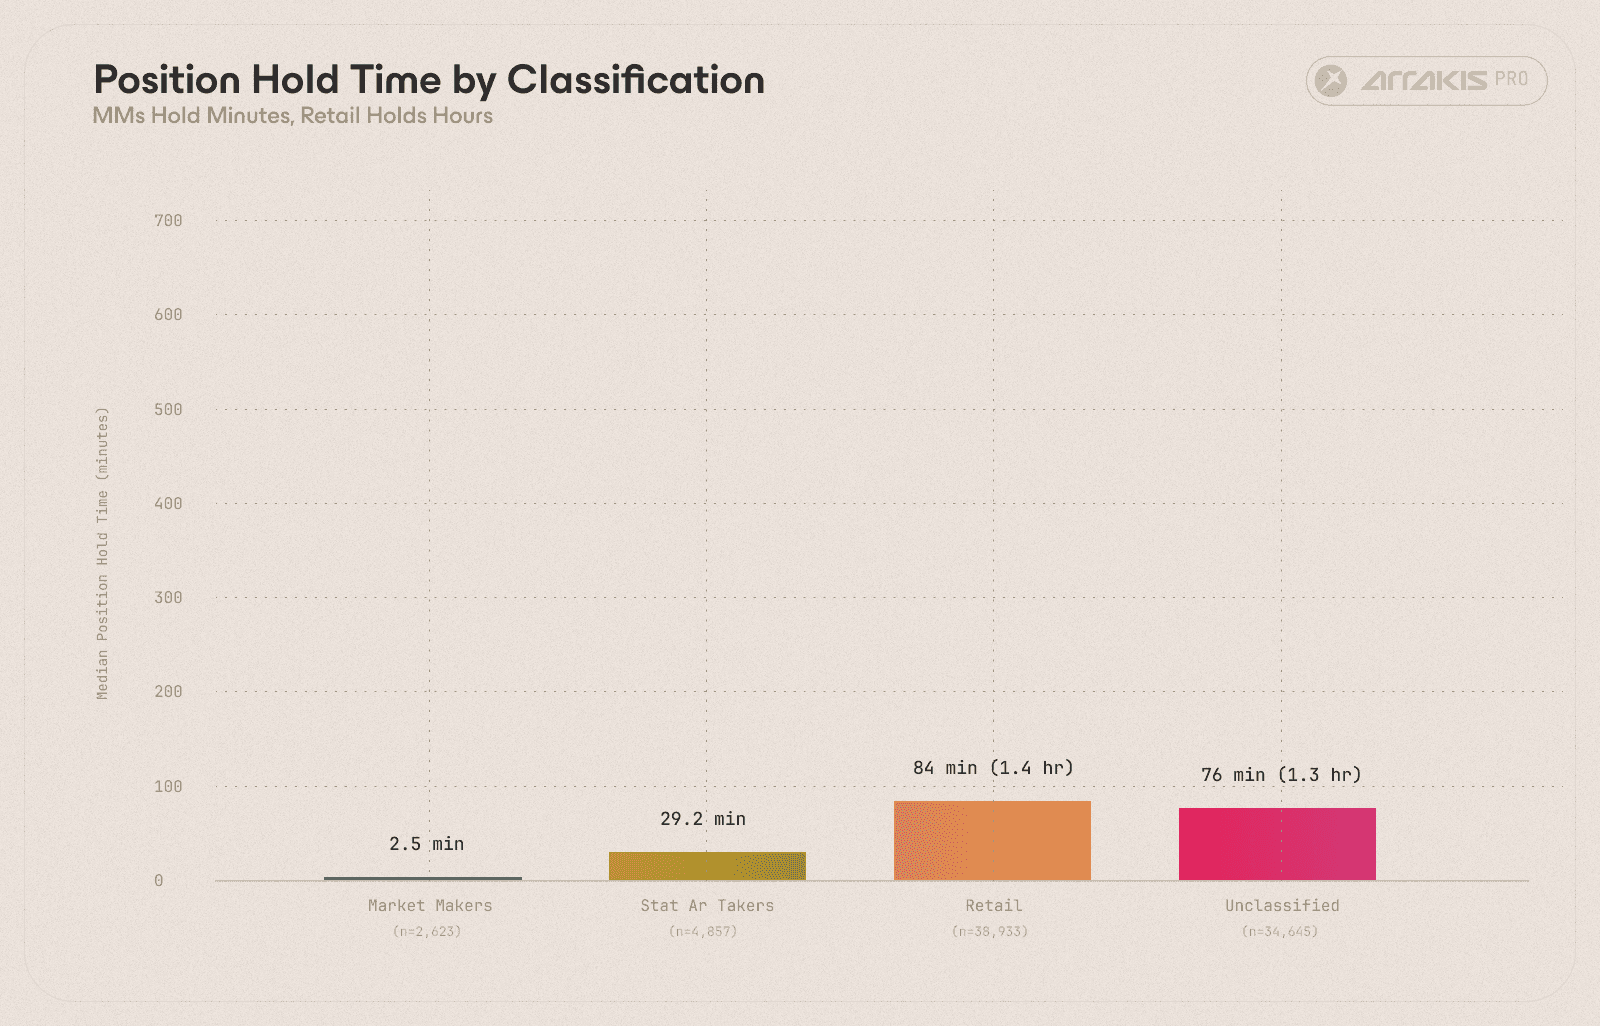
Figure 8. Median position hold time with IQR whiskers. Market makers held for 2.5 minutes, stat arb takers for ~29 minutes, and retail for ~84 minutes. The separation was clean across categories.
Order-to-Trade Ratio
Category | Median Orders per Fill |
|---|---|
Market Maker | 18.9x |
Retail | 2.7x |
Stat Arb Takers | 2.0x |
Unclassified | 2.0x |
Market makers placed 19 orders for every fill. This is the constant high-frequency requoting that a market maker engages in to keep liquidity priced at fair value, staying profitable for a market maker means not quoting at stale prices. Takers, by contrast, ran closer to 1:1.
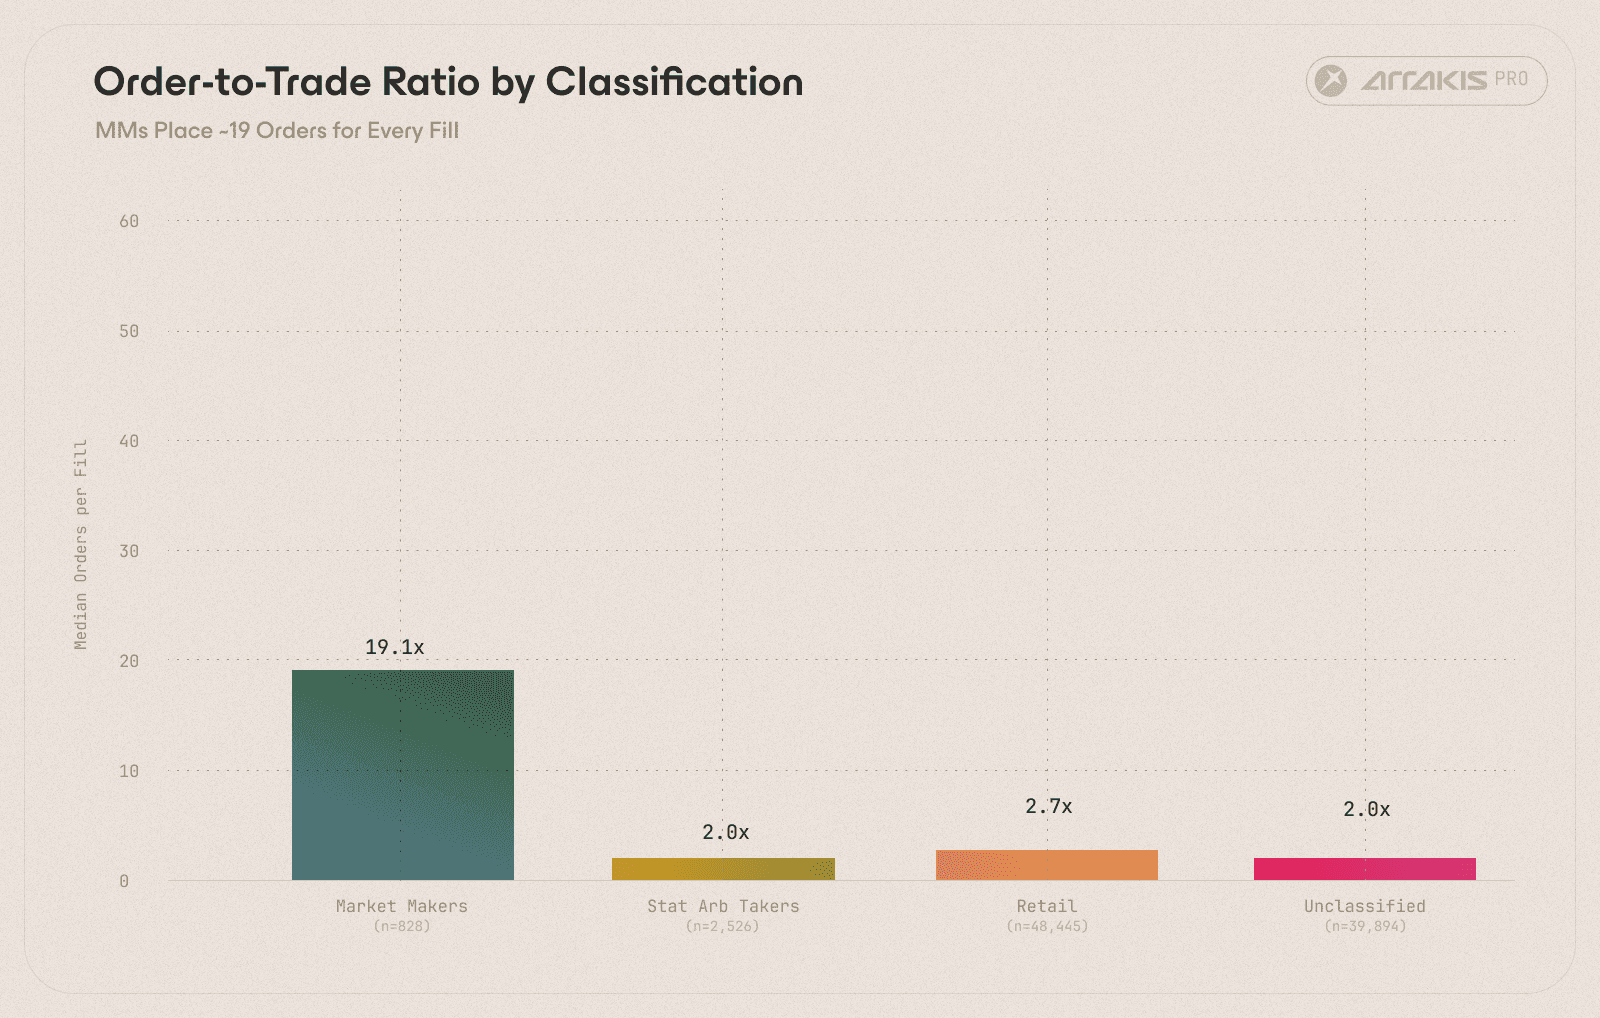
Figure 9. Median order-to-trade ratio. Market makers placed ~19 orders for every fill; all other categories clustered near 2x. 95% of MM order flow was quote updates that never executed.
MM Volume Concentration
Market making on HIP-3 was highly concentrated. A small number of wallets accounted for the majority of MM volume across all 7 markets.
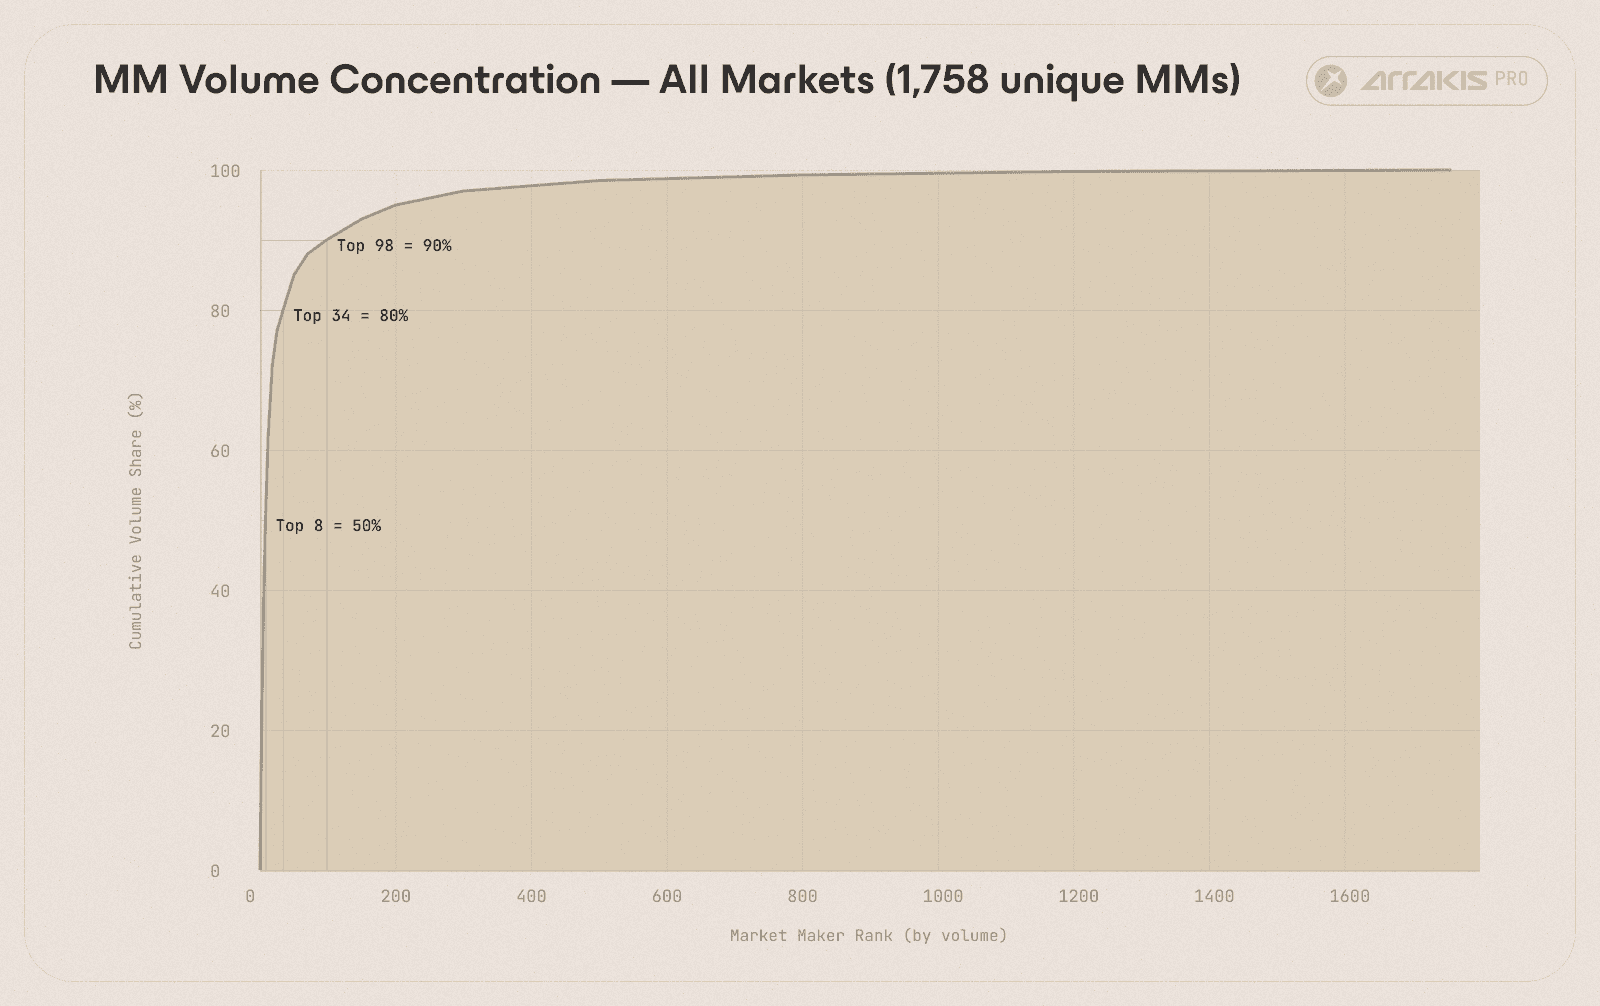
Figure 10. Cumulative MM volume share ranked by wallet. The top 8 wallets captured 50% of all market making volume; the top 68 reached 90%. Out of 1,758 classified MMs, the long tail contributed marginal volume.
Liquidation Rates
Category | % Ever Liquidated | Count |
|---|---|---|
Stat Arb Takers | 40.9% | 1,942 |
Retail | 21.4% | 11,721 |
Market Maker | 17.8% | 431 |
Unclassified | 14.9% | 14,461 |
Nearly half of the stat arb bots got liquidated on HIP-3 at some point. However, this does not mean they were losing money. These were likely one leg of a cross-venue hedge. When the HIP-3 leg moved beyond margin, it got liquidated, but the opposing leg on CME or another venue may have profited. The high liquidation rate was consistent with aggressive, leveraged arb strategies where individual-venue blowups were expected and managed.
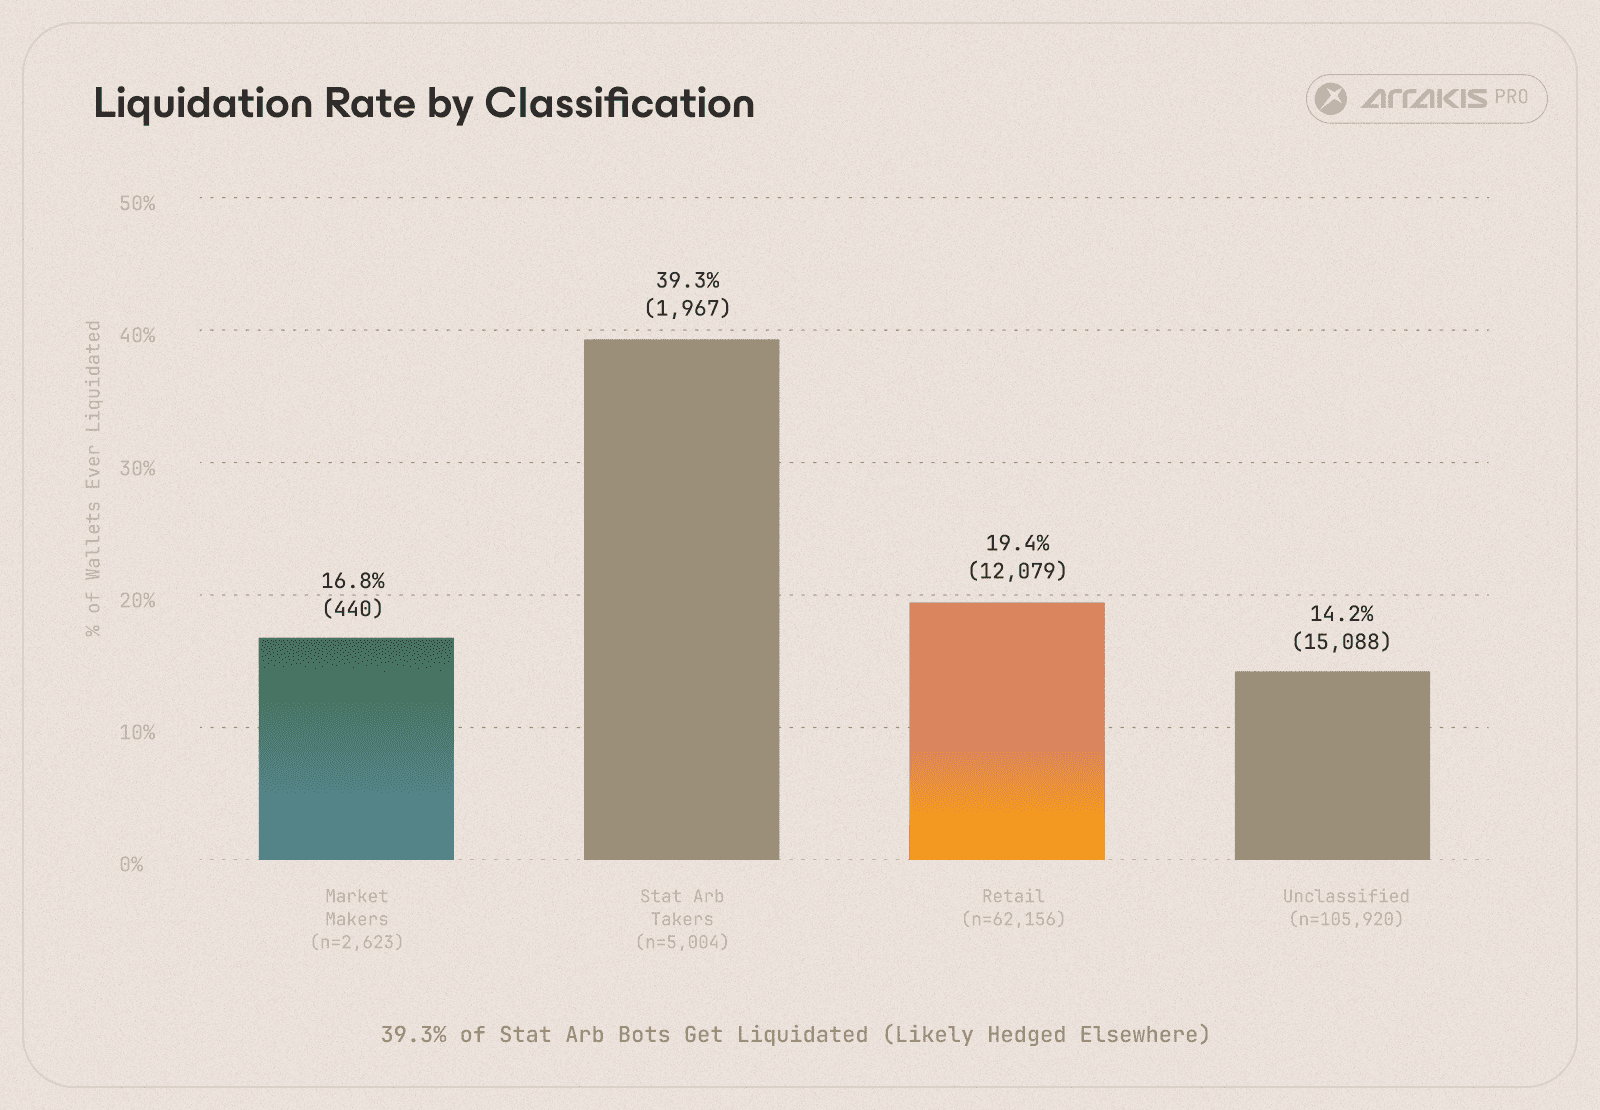
Figure 11. Percentage of wallets liquidated at least once. Stat arb takers led at 39.3%, consistent with aggressive cross-venue hedging where single-leg liquidations were expected. 1 in 5 retail wallets hit a liquidation.
What the Data Says About HIP-3's Market Structure
In a matter of monVths, seven HIP-3 markets assembled the participant structure of a functioning futures exchange, with market makers quoting both sides in high frequency, arb bots enforcing cross-venue price alignment, and a frontend aggregation layer routing retail order flow through the builder code system. When CME closed on weekends, Hyperliquid established itself as the sole price discovery venue for multiple asset classes.
The ecosystem is still in its early stages. But the participant roles, the infrastructure layer forming around builder codes, and the weekend price discovery dynamic all point in the same direction: the market microstructure for real-world assets on Hyperliquid is maturing in ways that resemble a traditional futures exchange.
Appendix: Full Classification Methodology
This section details the classifier gates, thresholds, and formulas used to label wallets.
Market Makers
A wallet was labelled Market Maker if it filled predominantly as a passive maker:

With minimum activity thresholds to filter noise:

Plus one of two confirmation tiers.
Tier A checked orderbook behaviour: the fraction of orderbook mutations that were cancellations rather than new placements.

A cancel rate of 0.75 means 3 out of 4 orderbook actions were cancellations. This is the quote-update pattern of a professional market maker continuously adjusting resting limit orders to track fair value.
Tier B (when orderbook data was unavailable), we checked fill symmetry via the median order flow imbalance on maker fills:

V_buy and V_sell are buy and sell fill volumes per hourly window. Low OFI meant the wallet filled roughly equally on both sides, consistent with two-sided quoting. A directional whale would show high OFI.
Result: 2,016 wallets passed the MM gate and had no retail signal (no web UI usage, no builder tags). They accounted for 11.8% of total volume ($19.1B) from just 1.1% of wallets.
Stat Arb Takers
After market makers were removed, remaining wallets were tested for stat arb behaviour. The gate required aggressive taker activity sustained over time:


Plus a signal of algorithmic execution. We used the temporal clustering score (TCS), which measures how bursty a wallet's trading is. For each wallet, we computed the inter-trade gap times (seconds between consecutive fills within 4-hour sessions). TCS is the ratio of the 95th percentile gap to the median gap:

A uniform trader (fills spread evenly) produces a TCS near 3 (the P95/P50 ratio of an exponential distribution). An arb bot that fires in bursts when oracle price updates create dislocations has a high TCS: most inter-trade gaps are tiny (the bot is firing) but the 95th percentile is large (the long pauses between bursts). The gate required:

The general approach of using inter-trade arrival time distributions to distinguish algorithmic from manual traders is established in the market microstructure literature (Hasbrouck and Saar, 2013; Baron et al., 2019).
Layer 2 supplement: IOC bot classification. The fills-based classifier missed taker bots whose fill features fell short of one or more gates but whose order submission pattern was unambiguously algorithmic. We promoted 551 additional wallets to Stat Arb Taker using order lifecycle metadata. All of the following had to hold:
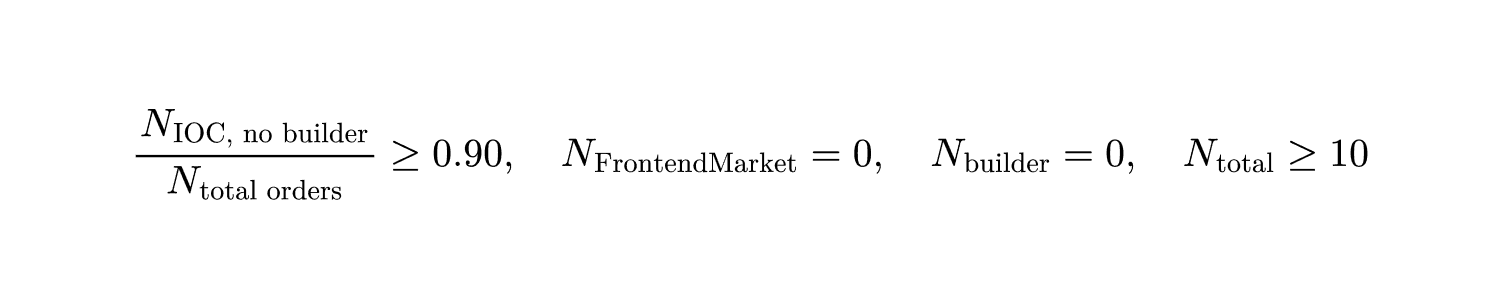
IOC (Immediate or Cancel) is an aggressive taker order type not exposed on the Hyperliquid web UI. A wallet submitting 90%+ direct IOC orders with zero frontend or builder activity was exclusively using the API. The 90% threshold filtered for noise and mixed activity.
Result: 2,935 wallets passed the SAT gate (clean, no retail signal). They accounted for 4.2% of volume ($6.7B) from 1.7% of wallets.
Retail
The statistical classifier used fill data only. To find humans, we utilised the second layer based on order metadata.
FrontendMarket TIF. The Hyperliquid web UI tags market orders with a special time-in-force flag: FrontendMarket. Any wallet with at least one FrontendMarket order was confirmed human.
Builder tags. The builder field is a per-order JSON tag attached when a third-party app submits the order on the user's behalf. Any wallet with paid builder activity (fee > 0) or activity through identified retail free builders was flagged retail.
Limitation. The Hyperliquid frontend does not tag limit orders. A human who only placed limit orders on the UI looked identical to an API bot. Our retail number was a floor, not a ceiling.
Result: 50,477 wallets carried a human signal. They accounted for 12.8% of volume ($20.7B) from 28.4% of wallets. As would be expected, retail showed up in large numbers but traded in smaller size.
References
Hasbrouck, J. and Saar, G. (2013). "Low-latency trading." Journal of Financial Markets, 16(4), 646-679.
Baron, M., Brogaard, J., Hagstromer, B., and Kirilenko, A. (2019). "Risk and Return in High-Frequency Trading." Journal of Financial and Quantitative Analysis, 54(3), 993-1024.
Builder labels: HyperTracker by Coinmarketman.

