Research



How to grow your TVL with secondary markets
For yield-bearing assets, looping has become a major source of TVL growth. Looping scales when holders can unwind on demand, ideally through an exit that settles in the same transaction. An asset can give holders that exit in two ways: an instant primary redemption, or a secondary market priced at NAV. The assets that scaled built one of these deep enough to absorb the slice of supply that leverage adds. Many issuers underbuild this piece, and it sets the ceiling on everything else.
This guide explores the mechanics and economics of looping and provides a practical guide for RWA issuers to kickstart looping on their own asset.
Special thanks to @krzysgogol, @Morpho, @Re7, and @Contango_xyz for their contributions to this research.
Introduction
Yield-bearing assets have crossed $21 billion in onchain AUM as of June 2026, more than 30 times their size at inception in 2023, with tokenised treasuries nearing $14 billion and private credit growing faster than ever. The pilot phase is over, and the question has moved from whether these assets belong onchain to which of them grow the fastestonce they arrive.
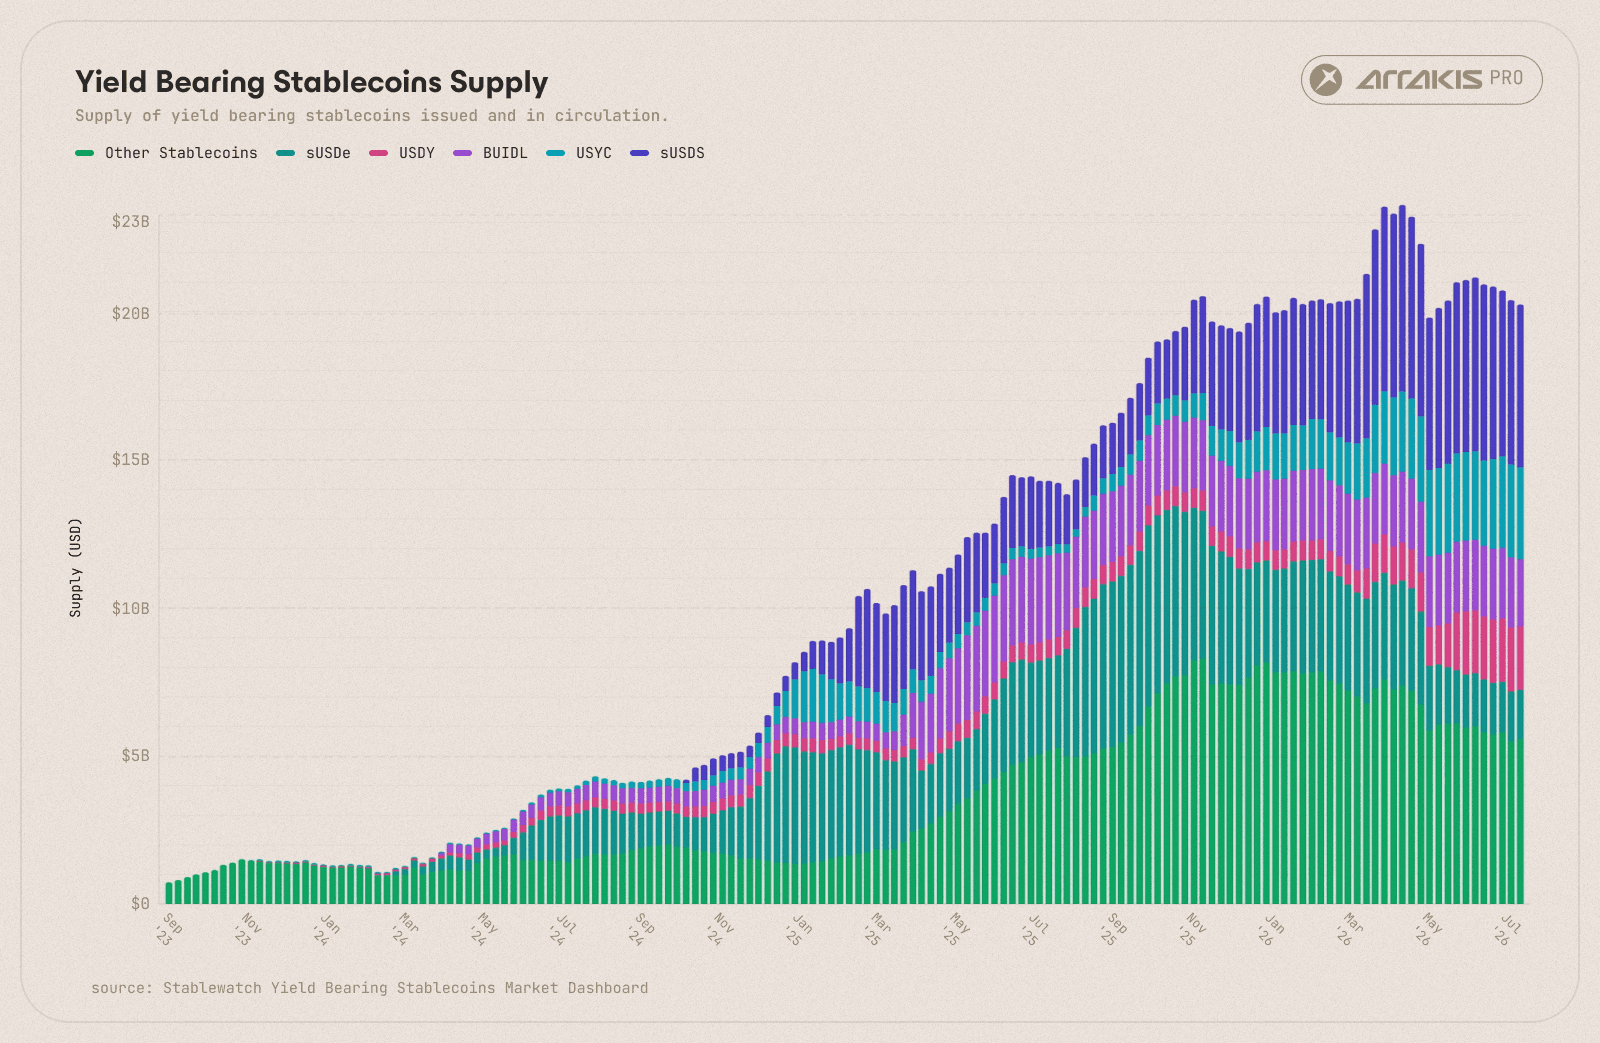
Total supply of the leading onchain yield-bearing assets, over time. The category has grown past $21B by mid-2026, more than 30 times its 2023 base. Source: stablewatch.io
An asset can be fully backed, audited, and live, and still stall, because when holding the token is all anyone can do with it, AUM stays roughly where direct deposits put it. The assets that broke out, sUSDe and syrupUSDC ahead of the rest, gave holders something to do with the token: borrow against it, and use the borrowed dollars to buy more of it. This practice is known as looping, and it is where the category's growth increasingly comes from.
This playbook walks through the trade itself, what it does for the issuer's TVL, and the piece of market infrastructure that decides whether looping can run at all.
How looping works
Looping is a recursive trade built on leverage. A holder takes a yield-bearing asset, posts it as collateral on a lending market, borrows stablecoins against it, buys more of the asset, and posts that as collateral too. Each pass adds exposure on the same starting capital.
Holders do it for boosted yield, points, or incentives. The return on a loop is the spread between the yield the asset accrues and what it costs to borrow against it, multiplied by how much the position is levered. While that spread is positive, each turn of the loop adds return without adding capital. A worked example shows why it is worth the trouble.
Illustrative.
A fund acquires $10M of an asset yielding 9%.
It posts the $10M as collateral on a lending market at an 80% loan-to-value ratio (LTV), borrows $8M of USDC, and buys $8M more of the asset.
It repeats the cycle, up to about $50M of the asset against $40M of debt, the ceiling an 80% LTV allows, since 1 ÷ (1 − 0.80) = 5×.
On that $50M the fund earns 9%, about $4.5M a year, and pays roughly 5% on the $40M it borrowed, about $2M. The net of $2.5M on its own $10M is a 25% return, from an asset that pays 9% unlevered.
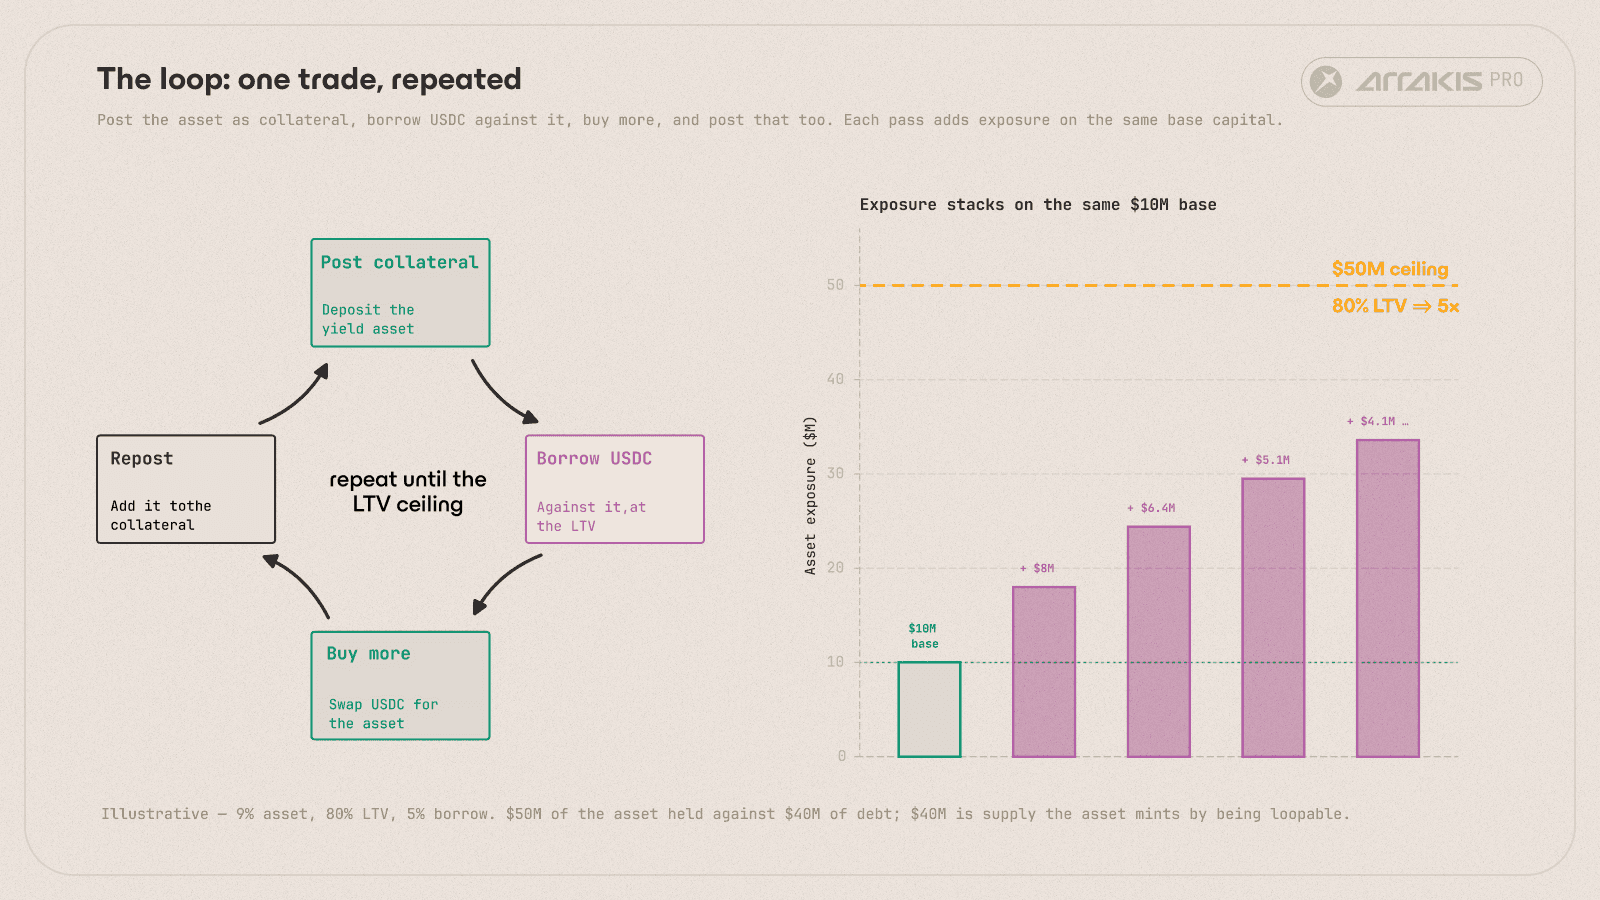
The loop: post collateral, borrow USDC, buy more, repeat, with exposure stacking from the $10M base toward the $50M ceiling.
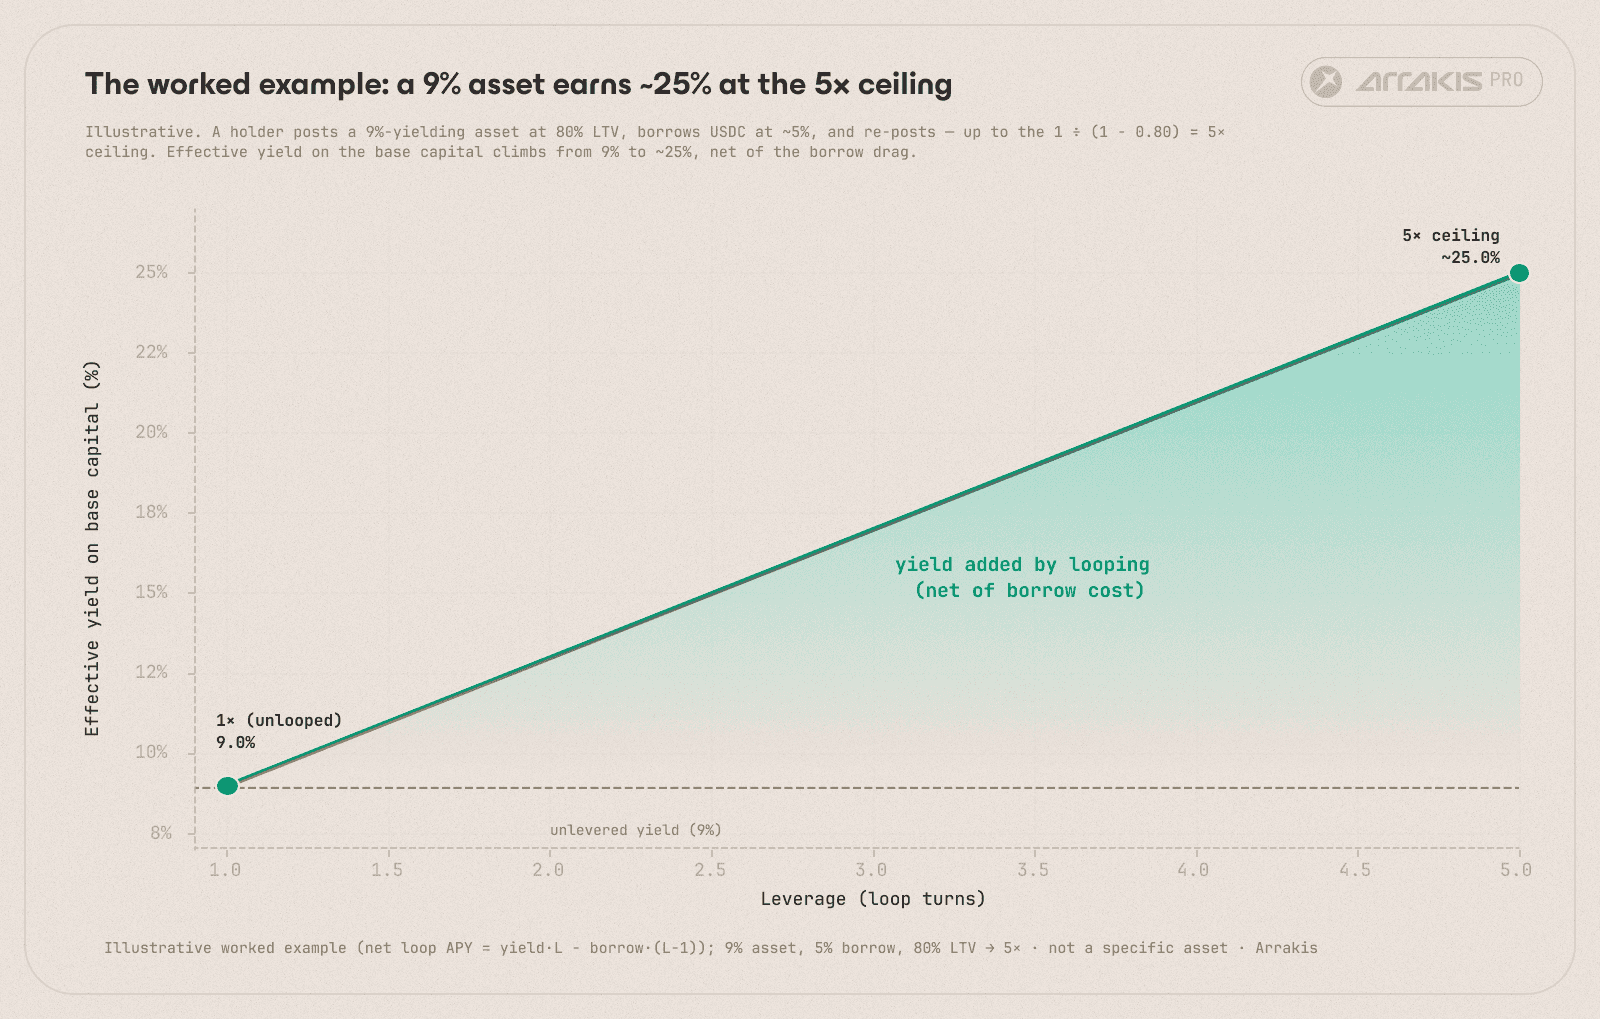
Effective yield against leverage, the example asset climbing from 9% unlevered toward ~25% at the 5× (80% LTV) ceiling, net of borrow-cost drag.
For the issuer, this means additional TVL on their asset. One fund's $10M of real deposits become $50M of the asset outstanding, and the extra $40M is supply the asset minted by being loopable. Multiply that across every holder running the trade, and looping becomes the engine of TVL and AUM growth for a yield-bearing asset.
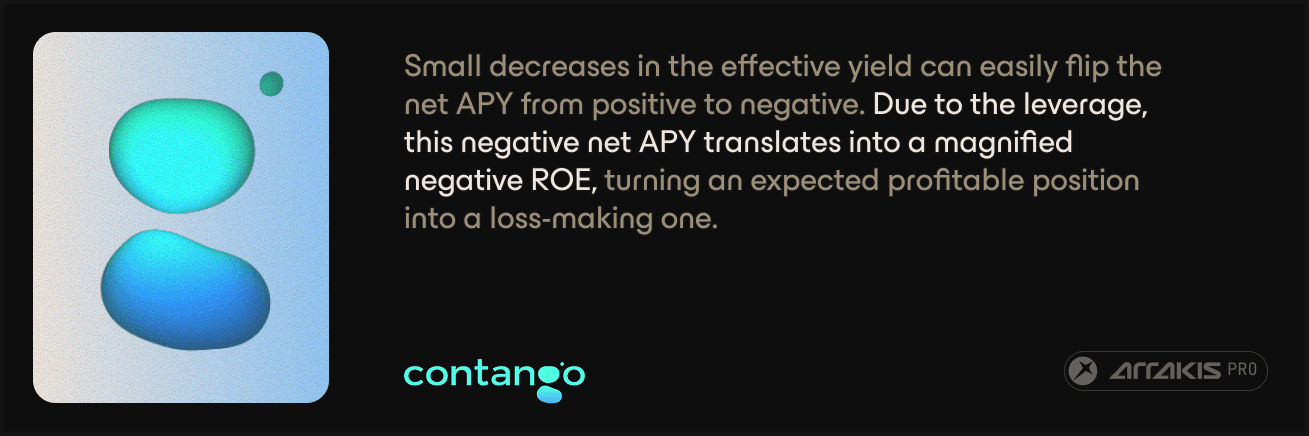
This trade only holds while the borrow-to-yield spread stays positive, and on real assets that spread is thinner than the example suggests. Higher leverage on the yield means higher leverage on drawdowns as well. A move against the asset hits a 5× position roughly five times as hard, so even a modest break from NAV. Where borrow rates and yield run close together, as with Treasury-backed tokens and, in our set, stcUSD (its cheapest borrow rate about level with its yield), a levered loop nets little after costs and can turn unprofitable outright.
As said best by Contango in their case study on unprofitable carry trades:
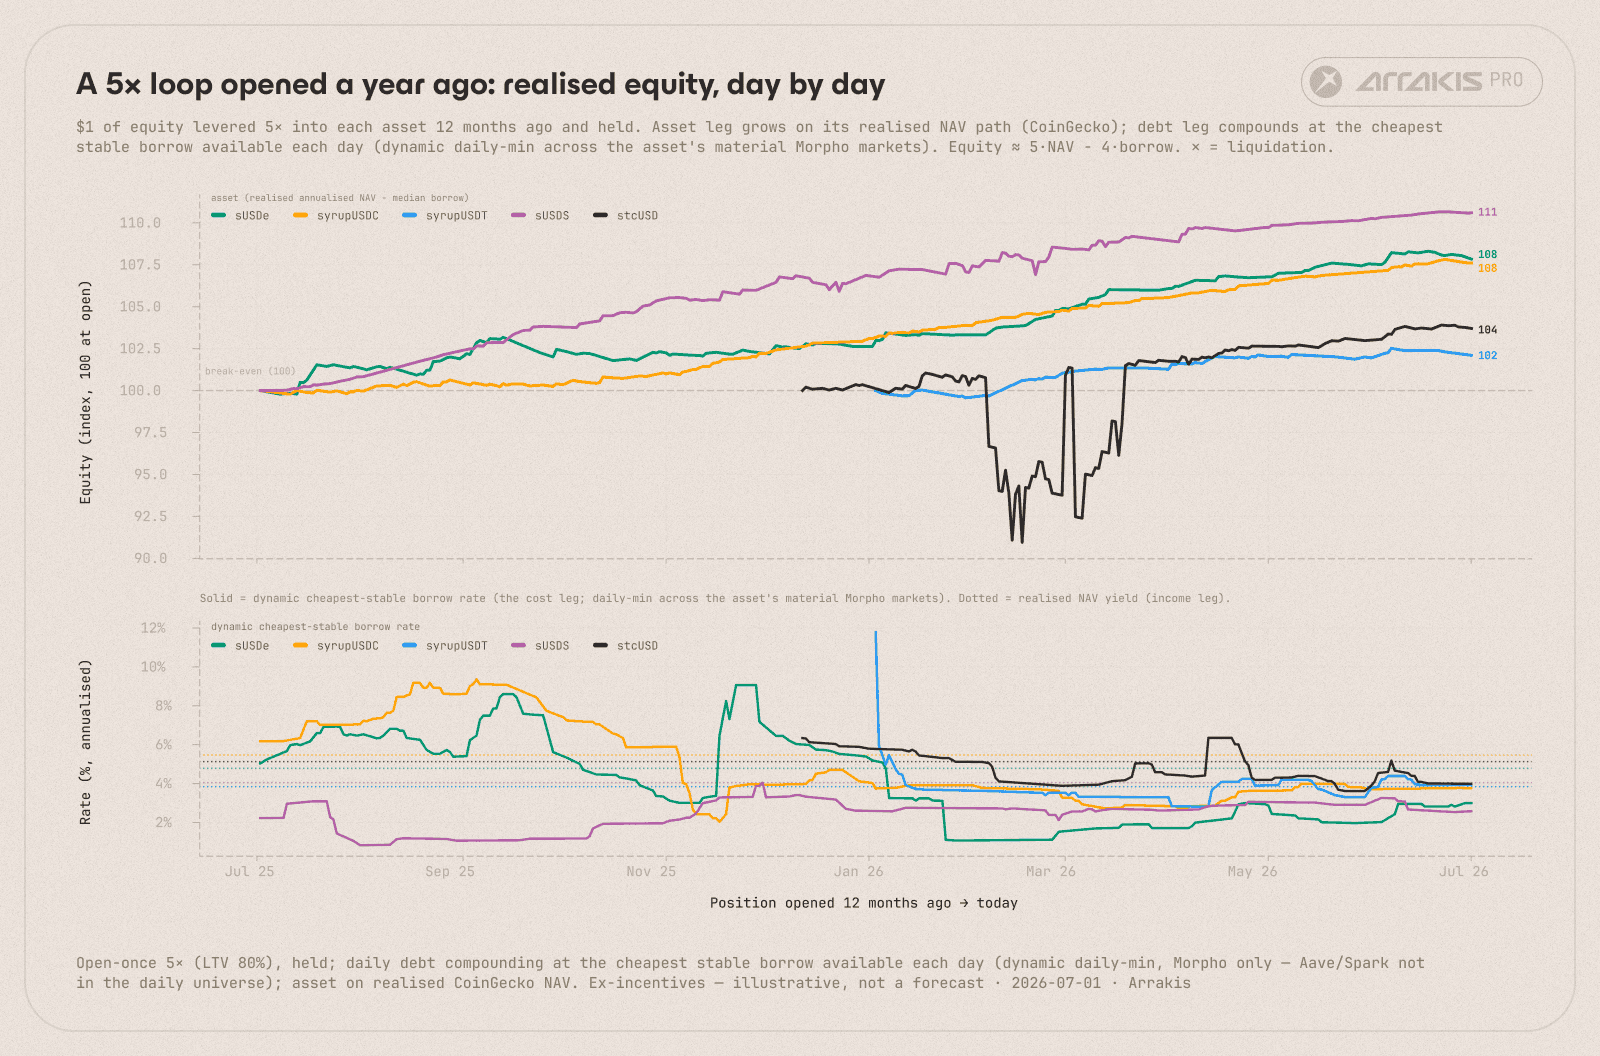
Looped vs unlooped realised return by loop depth (1× to 5×), on each asset's real trailing-12-month NAV appreciation and the cheapest stablecoin borrow available on each day (the daily minimum across its material Morpho markets). At the best available borrow, every looped asset carries positive. The loop pays more the further it runs: steepest where the borrow is cheapest (sUSDS), flattest where borrow meets yield (stcUSD). NAV-based and ex-incentives. Points and incentives lift the realised return above what is shown.
The issuer never runs the loop. The issuer builds the conditions that let holders run it, and three of those conditions have to hold to make the asset loopable:
a lending market whose curator lists the asset and sets an LTV high enough for the loop to be worth running,
lenders supplying USDC, USDT or other stables against the collateral asset at a low enough rate, taking the senior secured side of the same position and trusting the asset to hold value through a drawdown,
an atomic exit through which the position can be opened, adjusted, and closed in a single transaction at a fair price.
The first two are well understood, and most curators will list an asset on reasonable terms. The third is where assets stall, and the rest of this playbook explains why, and how to address it.
The looped share today
Whether holders can run that trade shows up directly in the supply data. We track it as Debt/TVL: the stablecoin debt held against each asset, over its market cap on Ethereum, the onchain measure of its TVL. It serves as a proxy for the looped share. Most of this debt is recycled into more of the same asset, though some funds other positions, so it bounds the looped share rather than measuring it exactly.
On that proxy, about $530M of debt sits against roughly $7.6B in market cap across the five looped assets in our set:
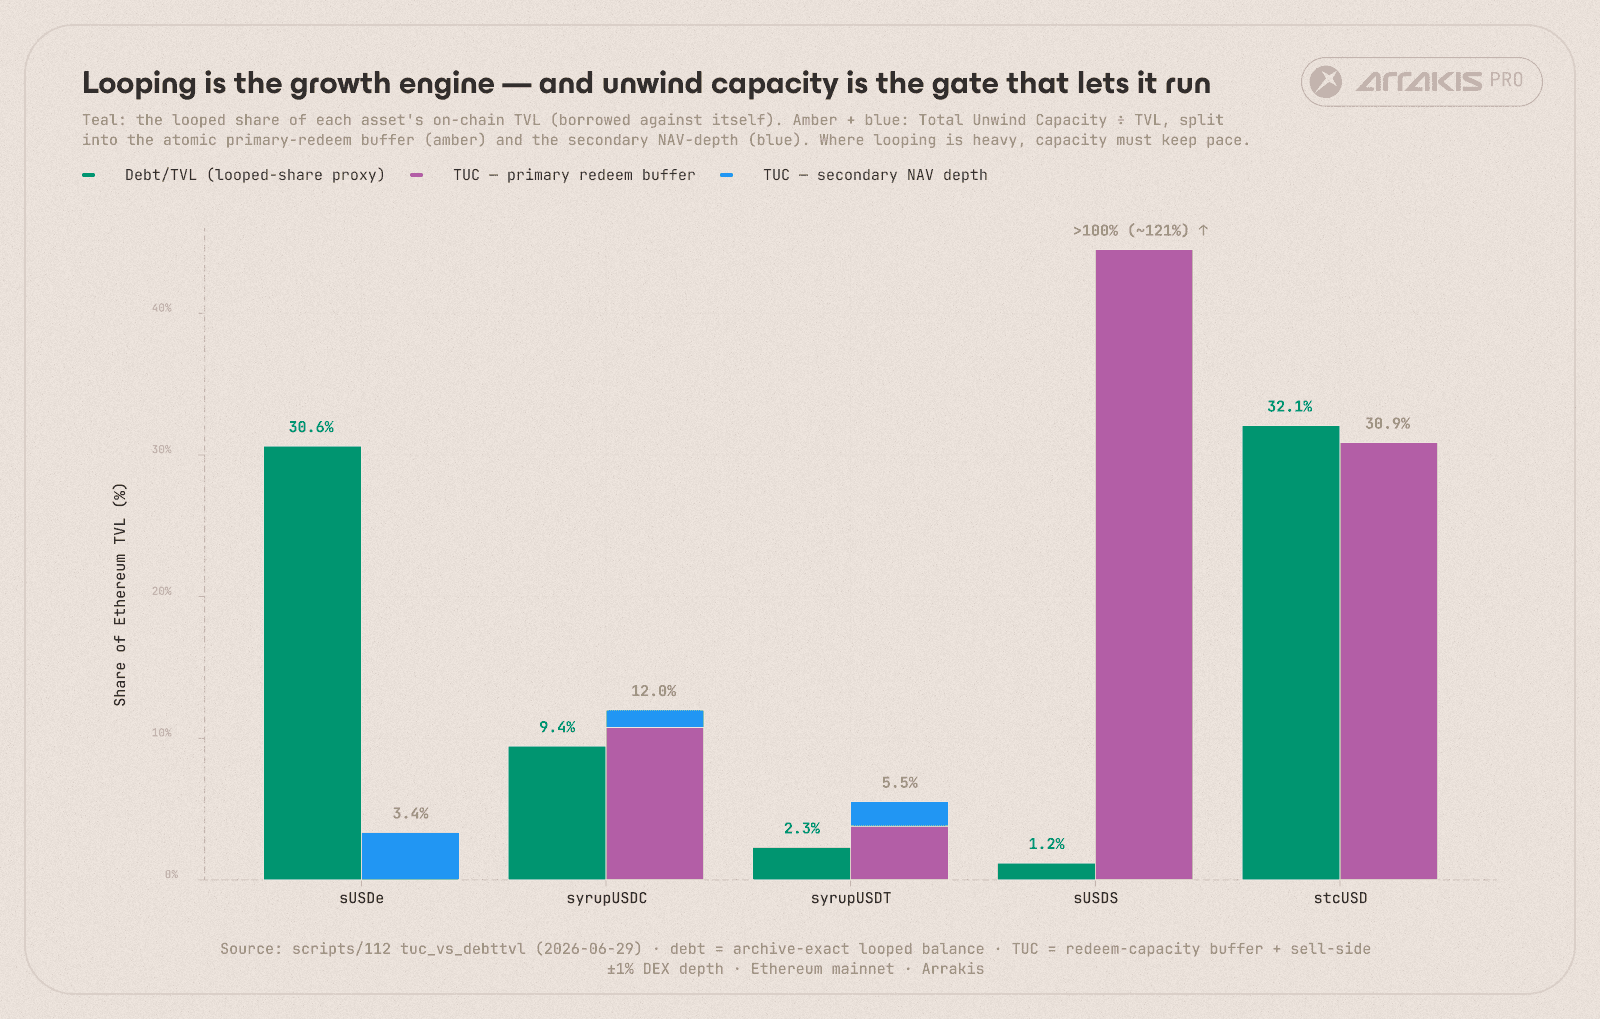
Per-asset Debt/TVL (the looped share of supply) against Total Unwind Capacity, the same-transaction exit each asset can offer. The looped slice and the exit that has to absorb it, side by side.
The range is wide: the tokenised treasuries sit close to zero, while sUSDe runs at roughly a third of its supply, and its looped share more than doubled over the past year, from 13.8% to 30.6%.
Compare two real assets. Ondo's USDY holds some of the safest reserves in the category and is still barely used as collateral in DeFi, because on Ethereum, where the looping venues live, there is no fast way out of it. Maple's syrupUSDC carries private credit risk that USDY does not, yet became one of the most borrowed-against dollars in DeFi, because a holder can exit it on demand.
What looping needs is an atomic exit: a way for holders to turn the asset back into stablecoins in a single transaction, at a price close to net asset value (NAV).
An asset can provide this exit in one of two ways, or a mix of the two.
The first is an instant primary redemption from a buffer the issuer holds, so the vault can pay out on demand.
The second is a deep secondary market priced at NAV: holders sell to standing liquidity onchain, and the market operator settles up with the slow primary redemption later, on its own schedule.
The secondary market becomes the essential route whenever the primary path is not atomic, gated by a cooldown, a redemption queue, or a settlement window.
Asset | Issuer | Exit mechanism | Classification |
|---|---|---|---|
sUSDe | Ethena | 7-day cooldown silo (unstake, cooldown, claim); no atomic primary redemption | Secondary-only |
syrupUSDC | Maple | FIFO withdrawal queue served first by an instant stablecoin buffer; AMM exit | Secondary + fast-exit Primary buffer |
syrupUSDT | Maple | FIFO queue + instant buffer; AMM exit | Secondary + fast-exit Primary buffer |
sUSDS | Sky | ERC-4626 redeem/withdraw, mint-on-demand same tx; Curve DEX also available | Primary + Secondary |
stcUSD | Cap | Atomic ERC-4626 stcUSD to cUSD to USDC via a fractional-reserve onchain buffer | Primary-only |
USDY | Ondo | Off-chain USD bank wire (T+1) + 40 to 50-day Reg-S lockup; no instant rail | Off-chain |
The same-transaction exit each asset offers, and whether it comes from the primary channels, the secondary, or both.
The problem: redemption windows
A yield-bearing asset returns capital through a primary redemption window, and that window is rarely fast: depending on the asset it runs from the same block to several weeks, gated by loan maturities, withdrawal queues, or KYC. sUSDe carries a seven-day cooldown, USDY is queue-based and whitelisted, and syrupUSDC clears in minutes only because Maple funds a large instant buffer.
A leveraged holder does not have days. When the spread turns or the position nears liquidation, the exit has to clear in the same block. That capacity is what we call Total Unwind Capacity (TUC), the sum of what the asset can pay out atomically through two distinct rails:
Total Unwind Capacity = atomic primary-redeem capacity + secondary depth at NAV.
The first term is the stablecoin buffer the issuer holds so the vault can redeem on demand. The second is the dollars a holder can sell into on the secondary market before the price moves off NAV. sUSDS runs a mint-on-demand primary that pays the full balance in the same transaction, and stcUSD redeems against an onchain reserve. Either rail on its own gives a holder an atomic exit, and it is the sum that has to cover the slice that might unwind at once.
Which rail carries the load differs by asset:
stcUSD redeems atomically against its own reserve, so it scales on leverage with little or no secondary market at all.
syrupUSDC clears most redemptions through a buffer in minutes, but the buffer can exhaust under a rush, so the DEX is the backstop the loop leans on under stress.
sUSDe has no atomic primary at all, so the secondary market is its only same-block exit.
Cork Protocol measured this for Maple as time to cash, and Serotonin's Effective Redemption Duration dashboard quantified the wait time. We extended that across the looped assets: sUSDe's median is about seven days, Maple's is minutes, Sky's is zero by construction.
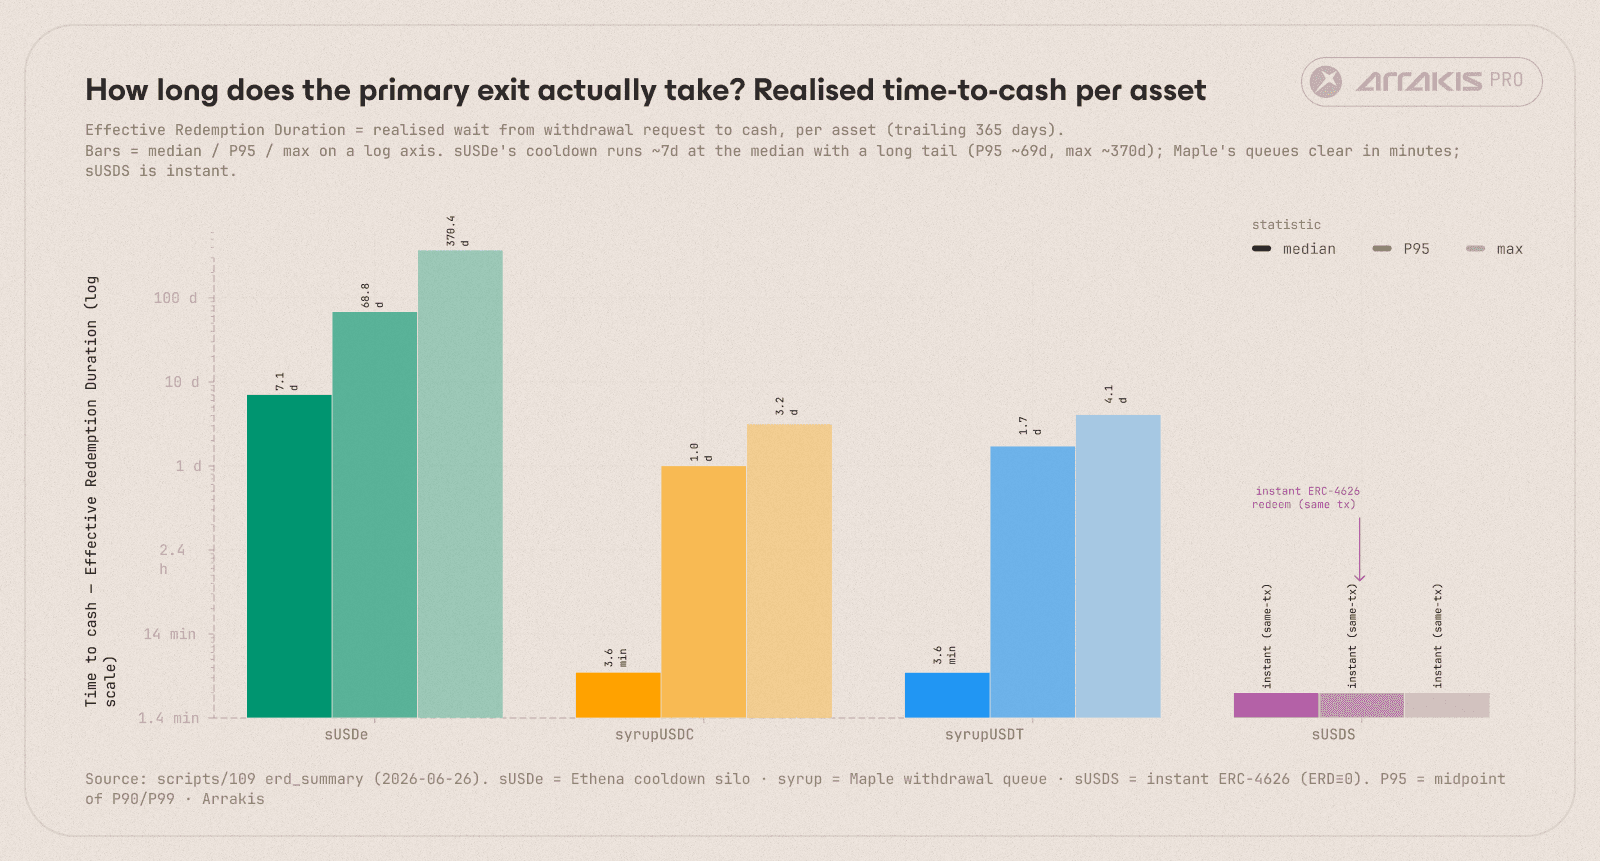
Effective Redemption Duration by asset, the realised "time to cash" on the primary rail: sUSDe's ~7-day median against Maple's minutes and Sky's instant.
Without an atomic exit on either rail, the failure chain runs as follows.
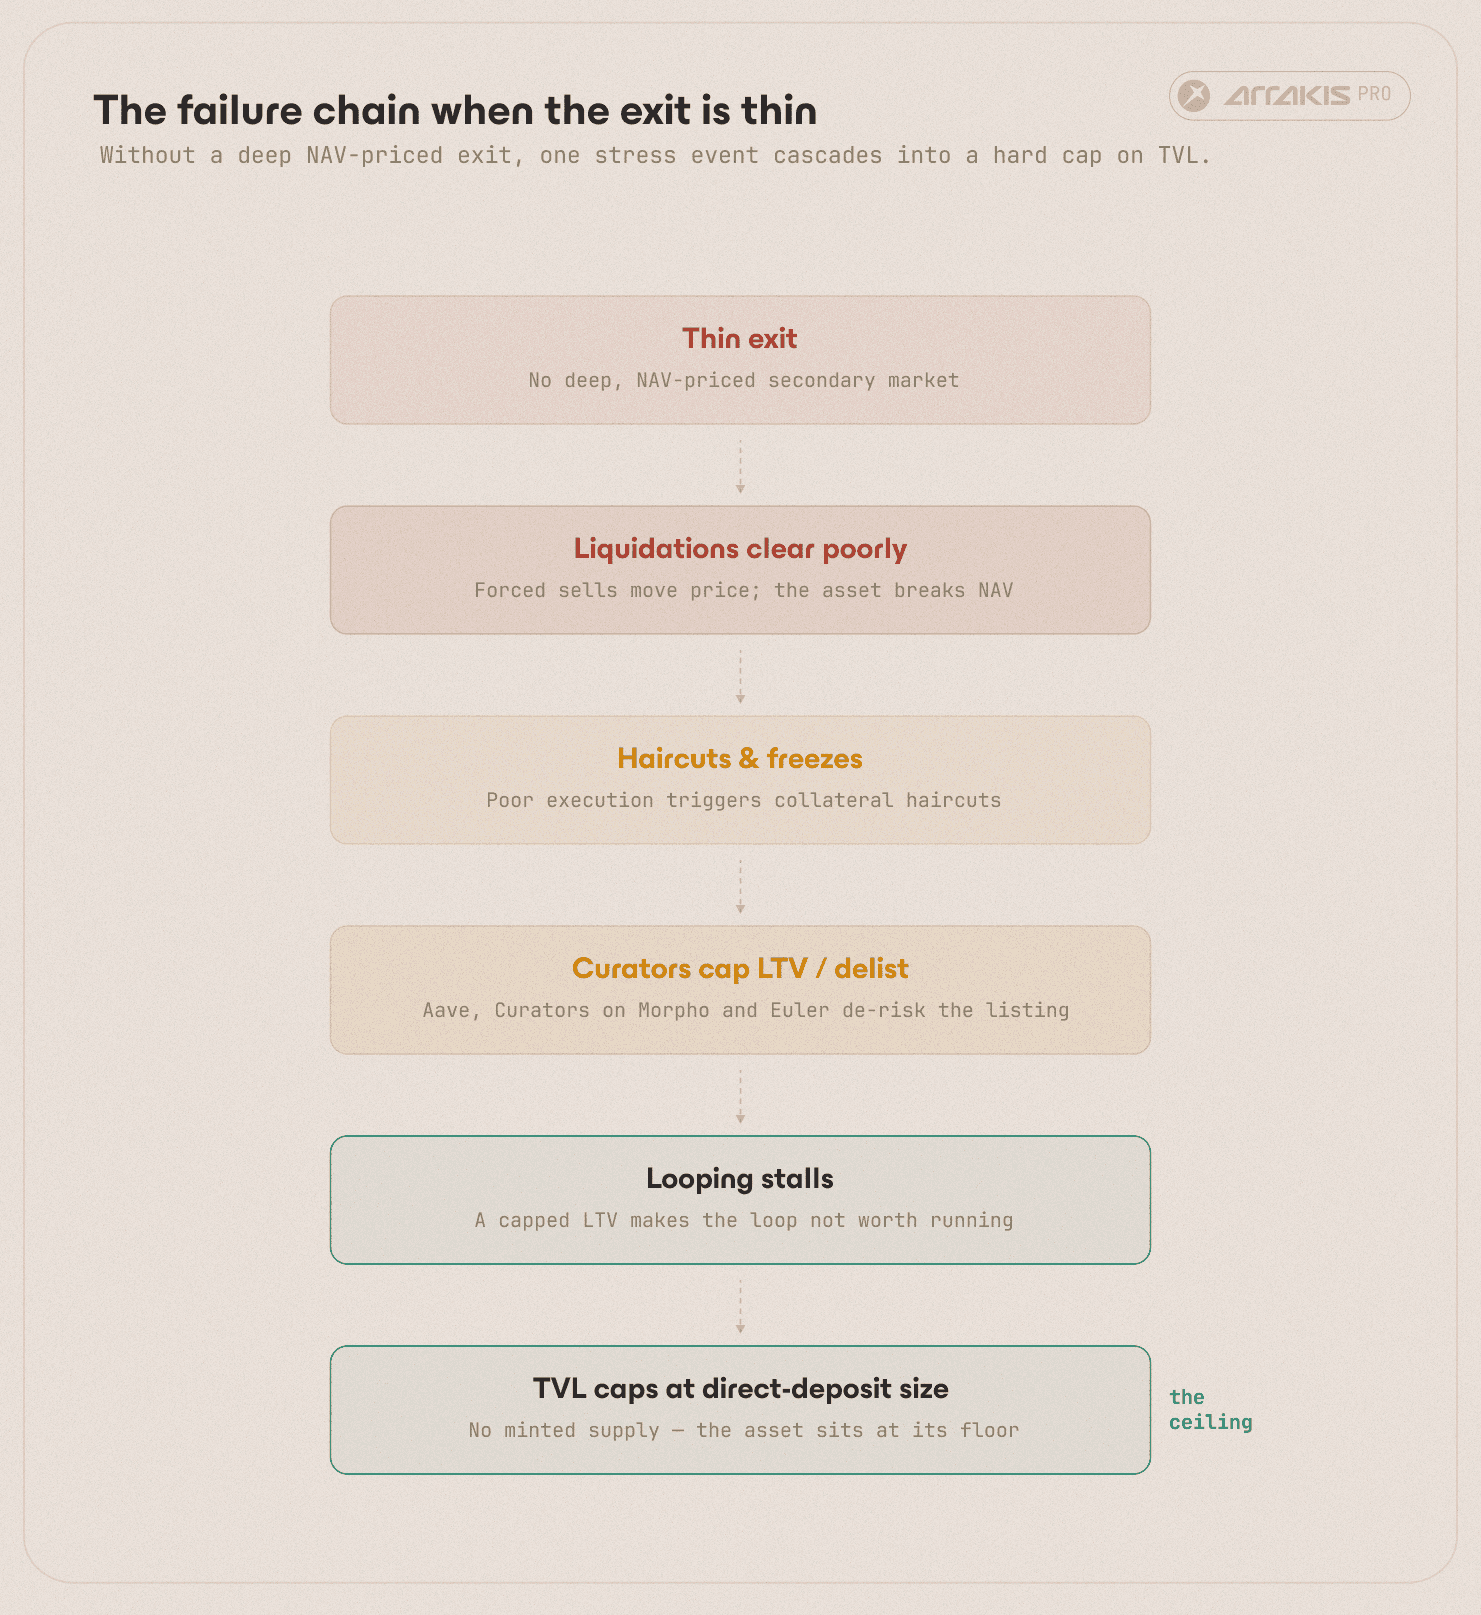
The failure chain.
Liquidations clear at poor prices, and the asset breaks from its peg.
Poor execution triggers collateral haircuts and freezes.
Curators on Morpho, Aave, and Euler respond by capping LTV, declining to list, or delisting.
A capped LTV throttles looping, and TVL settles back to the level of direct deposits.
Usual's USD0++, a four-year bond that lending markets had hardcoded at $1, repriced toward its discounted floor once redemption terms changed and leveraged holders rushed a thin exit. Elixir's deUSD collapsed with the counterparty that held 90% of it, leaving roughly $285M of stablecoin debt frozen across Morpho and other curated lending markets, supply that could not exit.
The merged profile below shows where each asset sits across both rails.
Asset | Primary redemption | ERD - median / avg / P95 | Secondary exit (depth at NAV) | Atomic instant-redeem capacity | Collateral use in DeFi |
|---|---|---|---|---|---|
sUSDe | 7-day cooldown silo (dynamic 1 to 7 d; 7 d in stress) | 7.09 d / 10.96 d / 34.07 d | ~$35.2M sell −1% (~10.7% cov.) | $0 primary (cooldown); DEX-only exit | ~30.6% (~$328M, Morpho + Aave) |
syrupUSDC | FIFO queue + instant stablecoin buffer | 0.0025 d / 0.067 d / 0.29 d | ~$14.7M sell −1% (~13.3% cov.) | ~$126.8M buffer (~10.9%); queued | ~9.4% |
syrupUSDT | FIFO queue + instant stablecoin buffer | 0.0025 d / 0.109 d / 0.47 d | ~$8.4M sell −1% (~77% cov.) | ~$18.5M buffer (~3.9%); queued | ~2.3% |
sUSDS | ERC-4626 mint-on-demand, same tx (no cooldown/queue) | (atomic) | ~$41.1M sell −1% (deep, ~70% cov.) | ~$5.87B vault, ~100% | ~1.2% |
stcUSD | Atomic ERC-4626 via fractional-reserve buffer | (atomic) | ~$0 (no material secondary) | ~$17.5M reserve (~25.6%) | ~32.1% |
USDY | Off-chain USD wire (T+1) + 40 to 50-day Reg-S lockup | (off-chain) | thin, ~$34k pool only | None (no onchain buffer) | ~0% |
The merged redemption + unwind profile, Ethereum, June 2026. Secondary depth is sell-side within −1% of NAV. Coverage (cov.) is secondary depth as a share of the stablecoin debt held against the asset. Buffer and reserve percentages are shares of market cap. Exit strength tracks the two capacity columns, secondary depth and instant-redeem capacity, not yield or reserve quality.
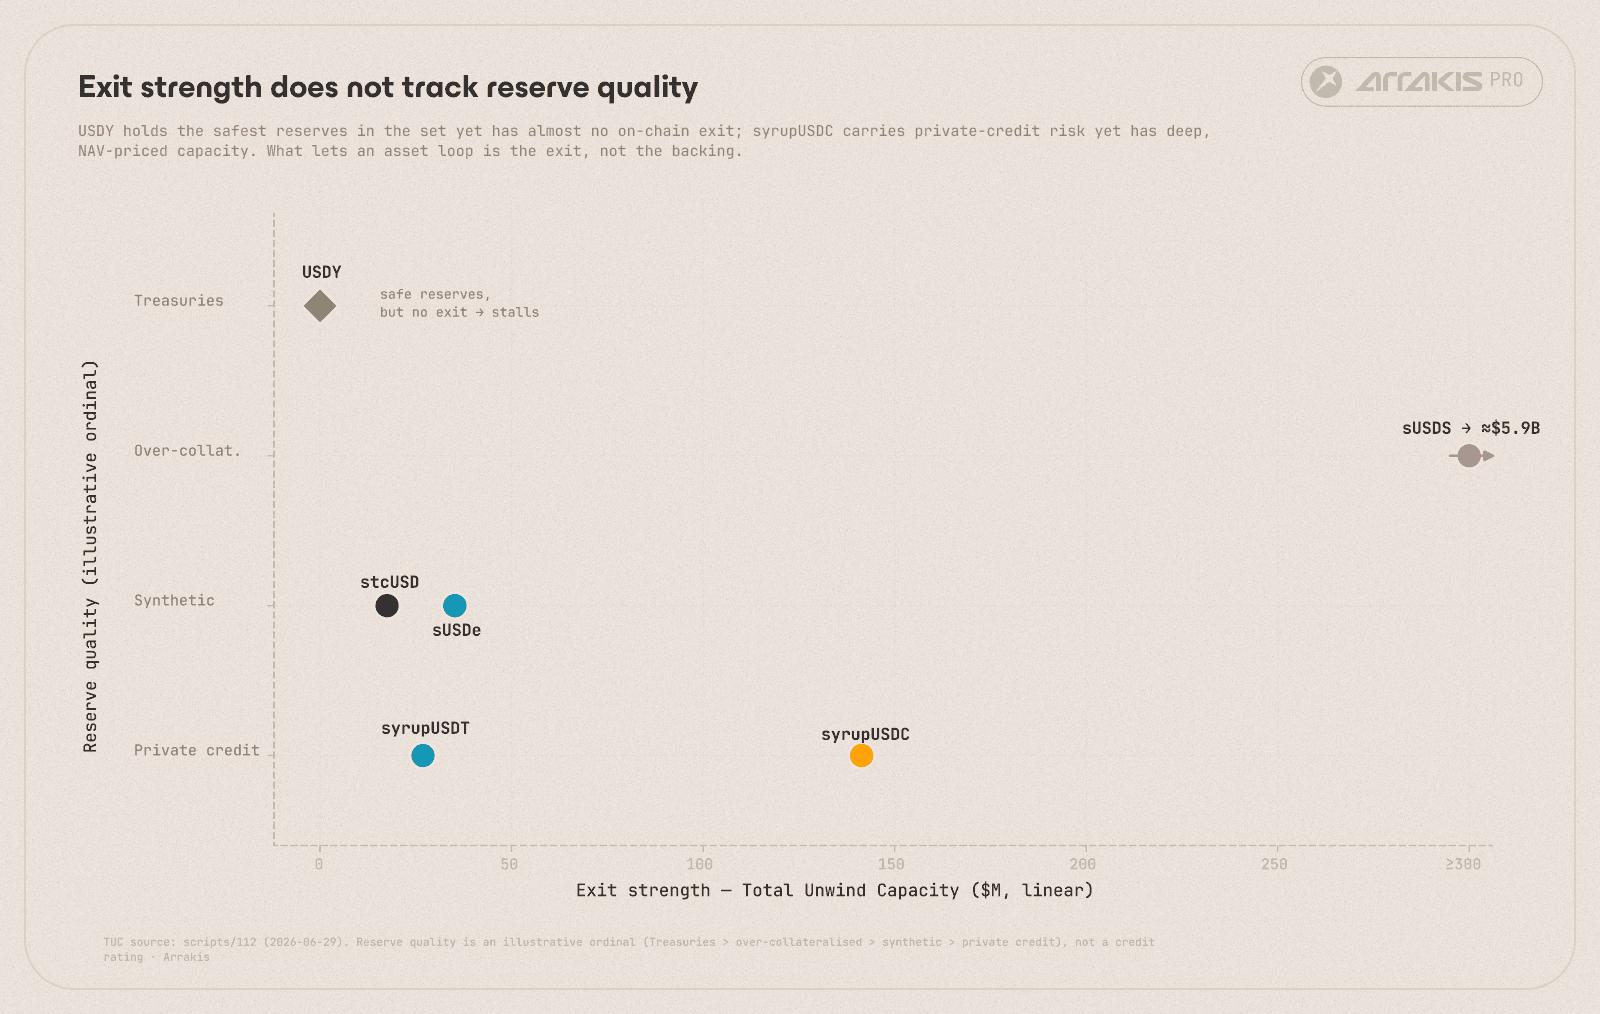
Exit strength (Total Unwind Capacity) against reserve quality, illustrative, to show the two do not line up: USDY pairs the safest reserves with the thinnest exit.
A looper opens a position only if it can be closed at a fair price when the spread turns, so they size to the atomic exit available: an asset paying 12% they cannot exit is worth less than one paying 8% they can. A curator keeps the lending market solvent, so every loan has to be liquidatable at a predictable price, and a thin exit forces a low LTV or no listing at all. Deepen the exit, and the same curator can raise the LTV.
The same logic runs through every isolated lending market. Lenders take the senior secured side against the asset, so in a drawdown its unwind capacity is what stands between them and a bad-debt write-off. The curator's LTV, the lenders' supply, and the looper's willingness to size up all rest on the same foundation: the asset's Total Unwind Capacity.
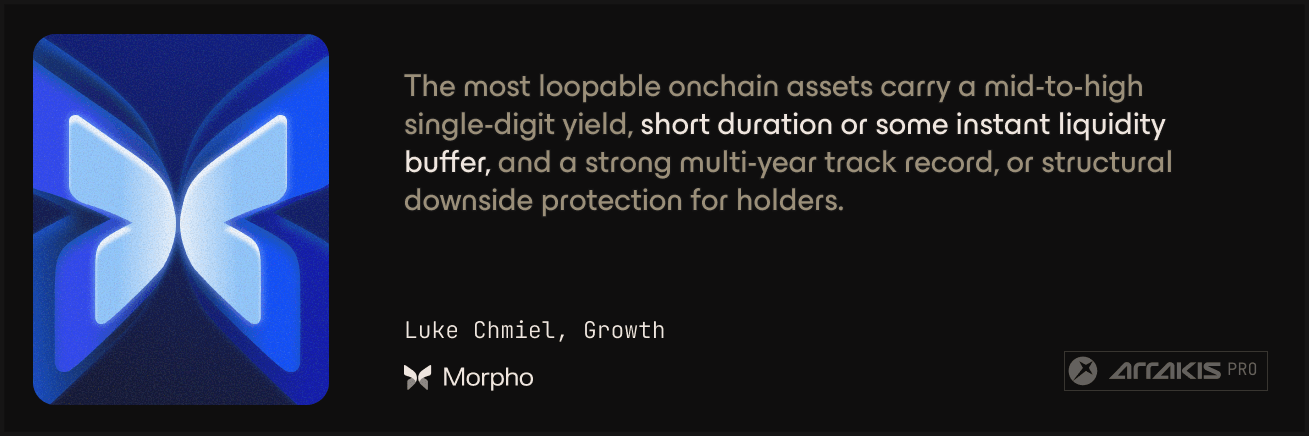
The solution: deep secondary markets at NAV
For an asset whose primary redemption is not atomic, a deep secondary market priced at NAV closes the gap. A holder sells into the pool at fair value and holds stablecoins in the same block, while the operator rebalances against the slow primary on its own schedule, minting or redeeming as needed. The slower the primary window, the more the asset's unwind capacity has to come from secondary depth.
The two rails also cost the issuer differently. An instant buffer pays out at par but sits idle: unlent stablecoins drag on the yield the asset advertises, and the buffer has to grow with TVL to stay credible. Secondary depth, by contrast, earns trading fees, does not dilute the asset's yield, and can come from a third party rather than the treasury. Most of the scaled assets run a mix, a buffer for routine flow and secondary depth for stress and size.
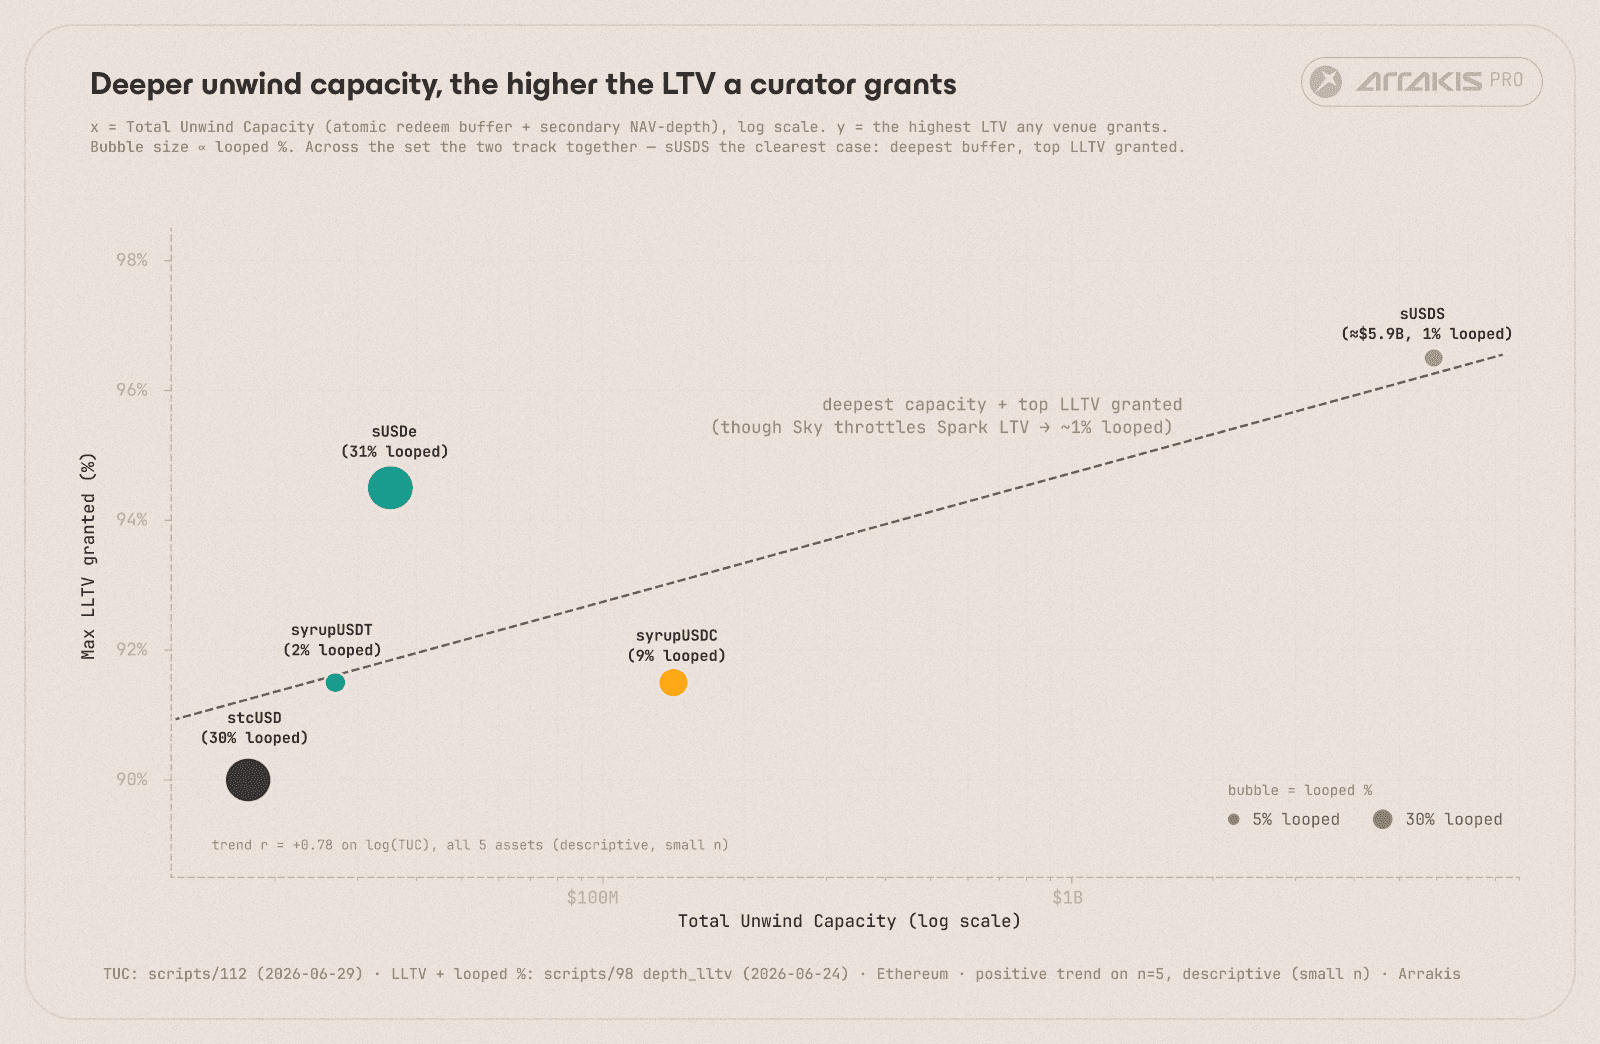
Total Unwind Capacity against the LTV a curator can support, by asset, deeper unwind capacity lifts the LTV ceiling a curator will grant.
Holding the price at NAV is the hard part, and it is where an ordinary AMM struggles. A pool re-prices only when someone trades, so it drifts between trades. For liquid tokens arbitrageurs close that gap, but for thin RWAs the arbitrage is too slow and too complex to be worth it, so the price drifts unchecked.
Arrakis Price Convergence removes the dependence on arbitrage. On each rebalance, the Arrakis Pro hook on Uniswap v4 reads the asset's NAV reference, an oracle or its onchain exchange rate, and updates the pool price to match within the same transaction. This leaves no gap to arbitrage, and no need for an arbitrageur to show up at all.
A working secondary market for a yield-bearing RWA needs three things:
An onchain NAV reference the pool can read, an oracle or an ERC-4626 exchange rate.
Sell-side depth skewed to the dollar, so stablecoins are waiting at the exit when holders and liquidations need them.
Active rebalancing that follows the asset up the yield curve and mints supply on demand, so the depth stays where the trading happens.
Sizing the secondary market
The depth does not have to match TVL. It only has to absorb the looped slice that unwinds at any one time, so a modest pool backs a large multiple of TVL. The LTV implies a largest plausible liquidation, and the pool should be sized to clear that unwind without moving off NAV.
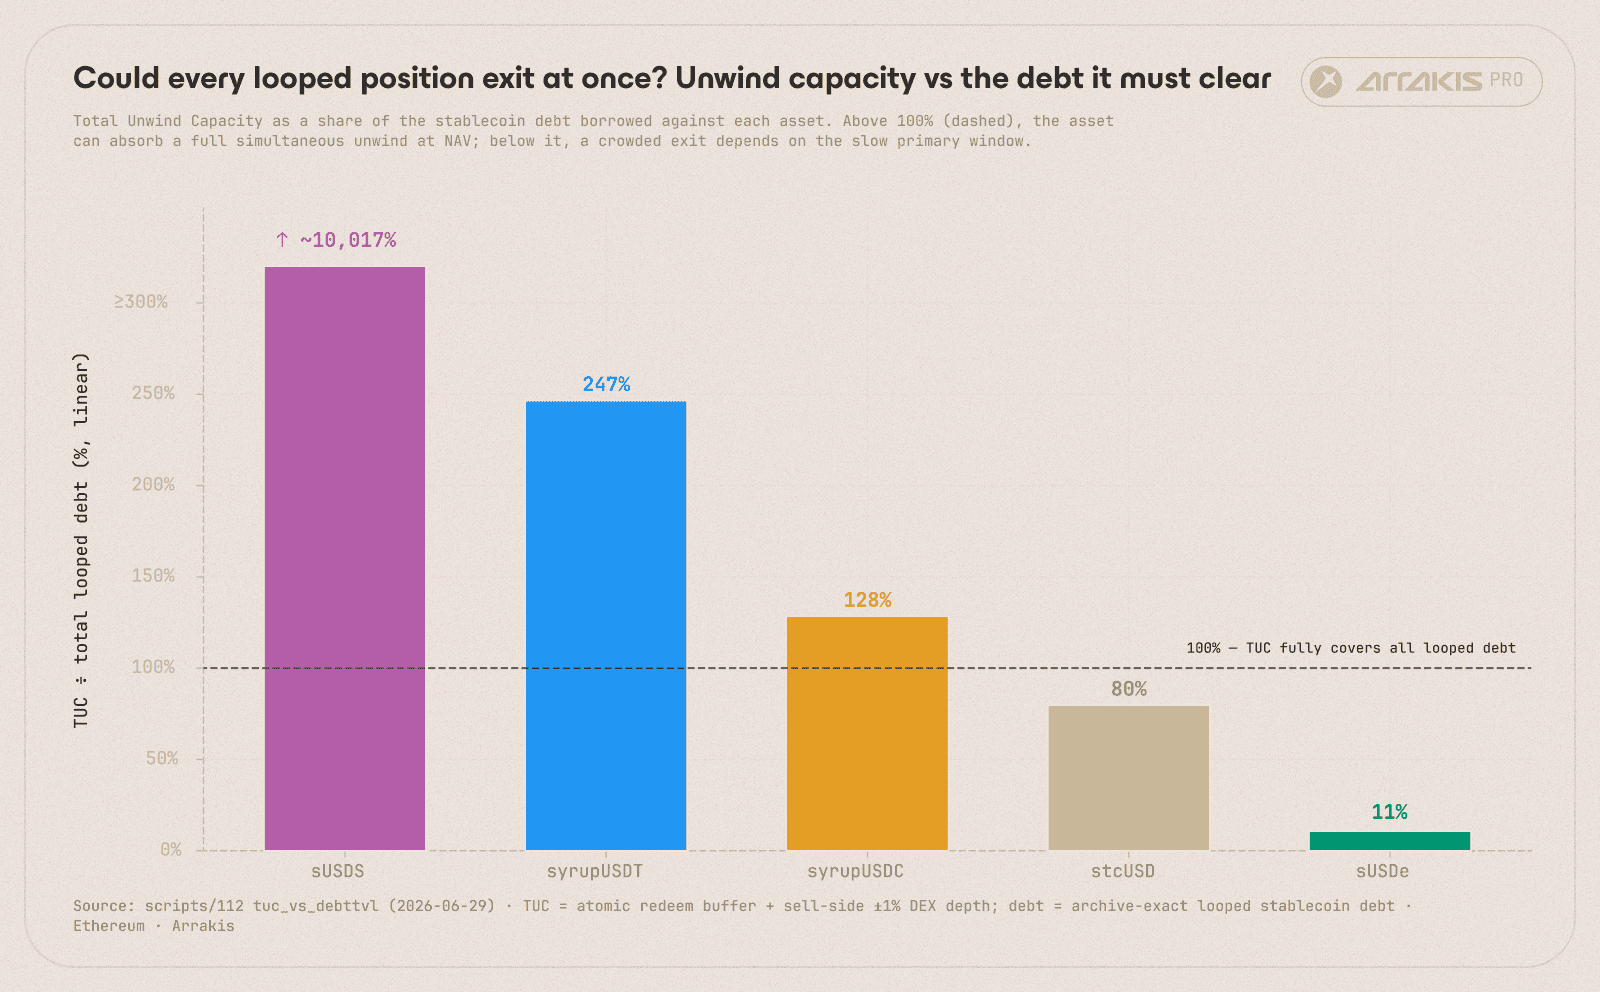
Total Unwind Capacity as a percentage of the stablecoin debt held against each asset: how much of the looped book each asset can absorb in a same-block unwind.
syrupUSDC in production
Maple's syrupUSDC runs this design today. It accrues 6 to 8% and drifts up in price as it does, a drift that kept pushing manually managed positions out of range. Arrakis replaced that with a self-rebalancing position on Uniswap v4, skewed up to 99% to USDC for high exit depth and deployed across chains, composing over Maple's ERC-4626 vault to mint syrupUSDC on demand for rebalances, with dynamic fees that rise on volatile flow.
Trading quality improved with the managed position.
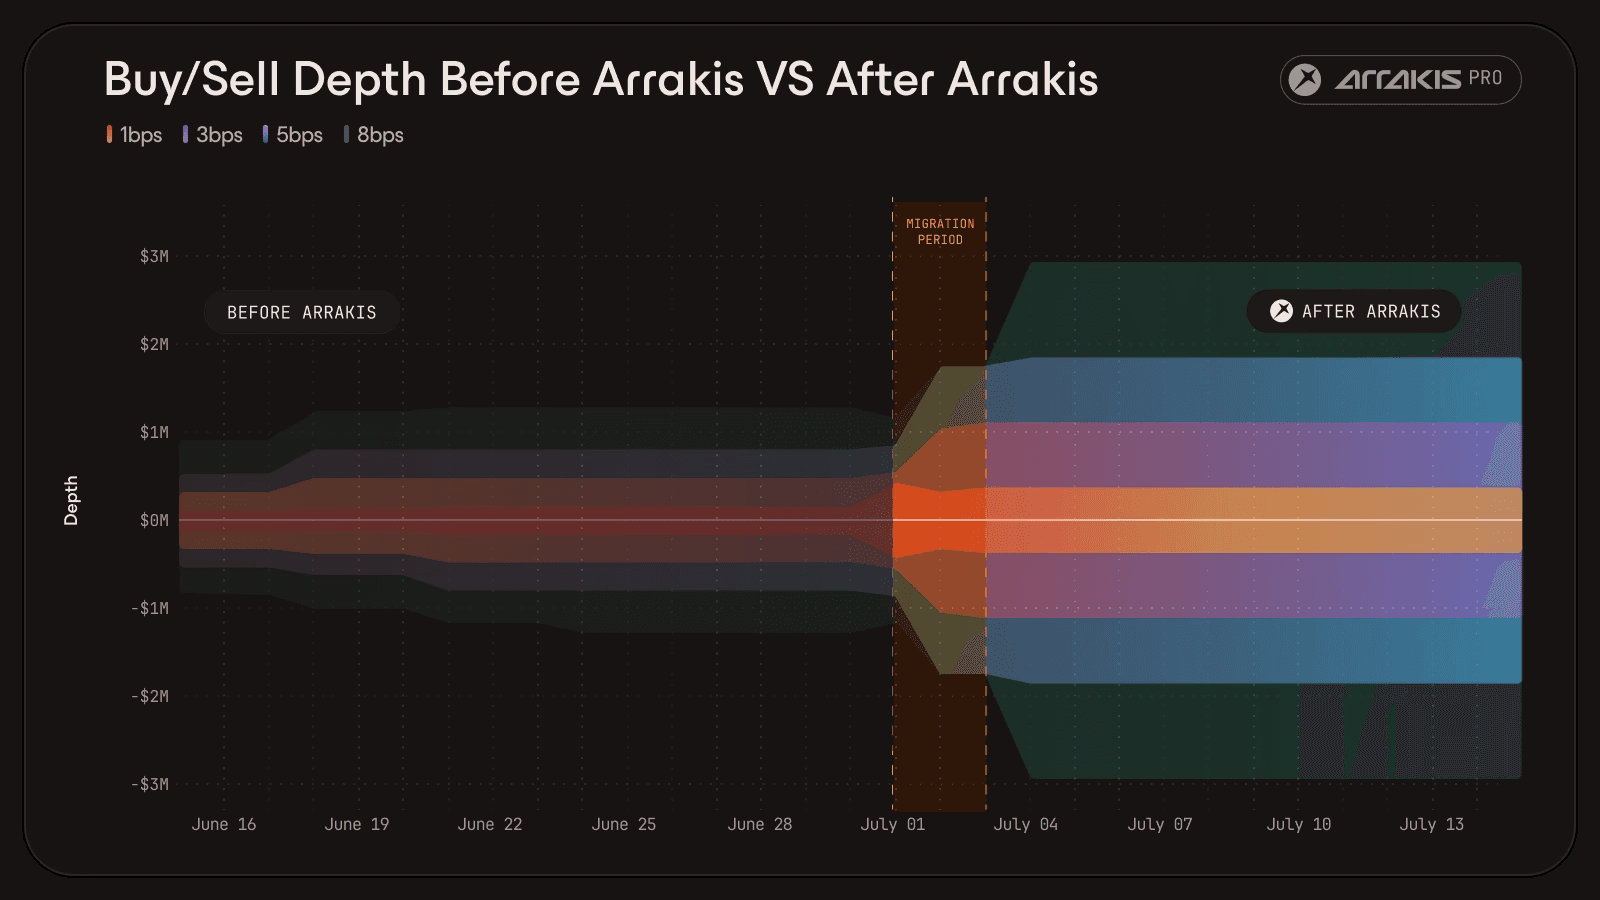
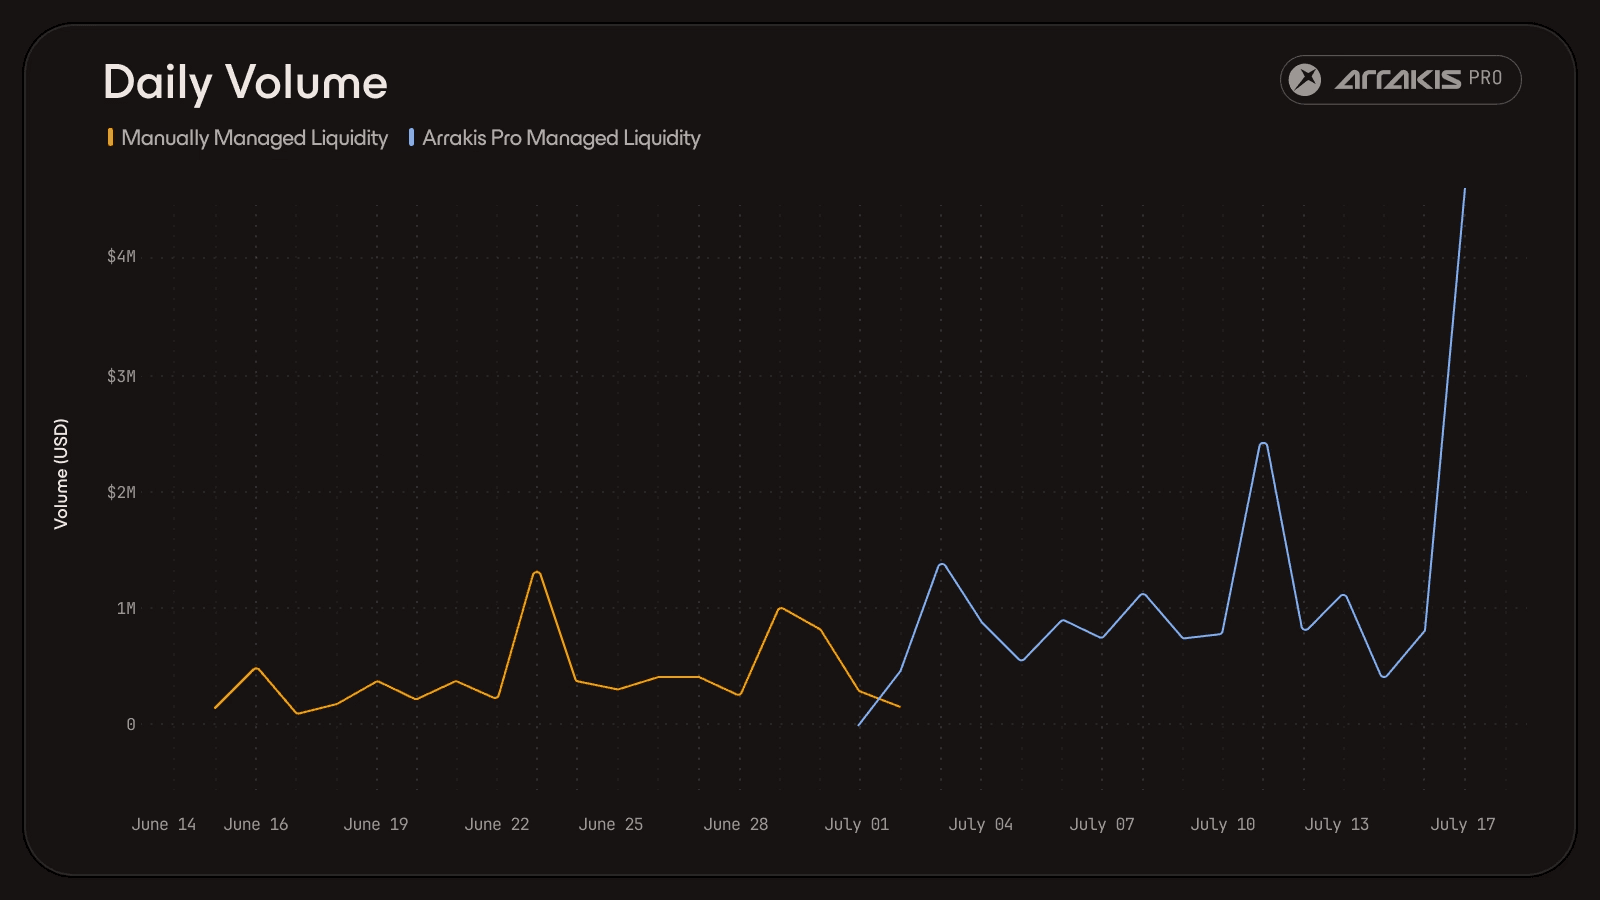
syrupUSDC before and after Arrakis: daily volume $453k to $1.14M, price impact on a $3M swap down 56.69%, average swap size $17.3k to $58.7k.
As of June 2026, Arrakis manages roughly $11M of that depth on Uniswap v4, with $10M of USDC sitting within 0.35% of NAV, alongside about $10M on Orca and the large instant-withdrawal buffer on Maple's primary side. The buffer clears routine redemptions in minutes, and the secondary market holds the price for everything that has to exit in between.
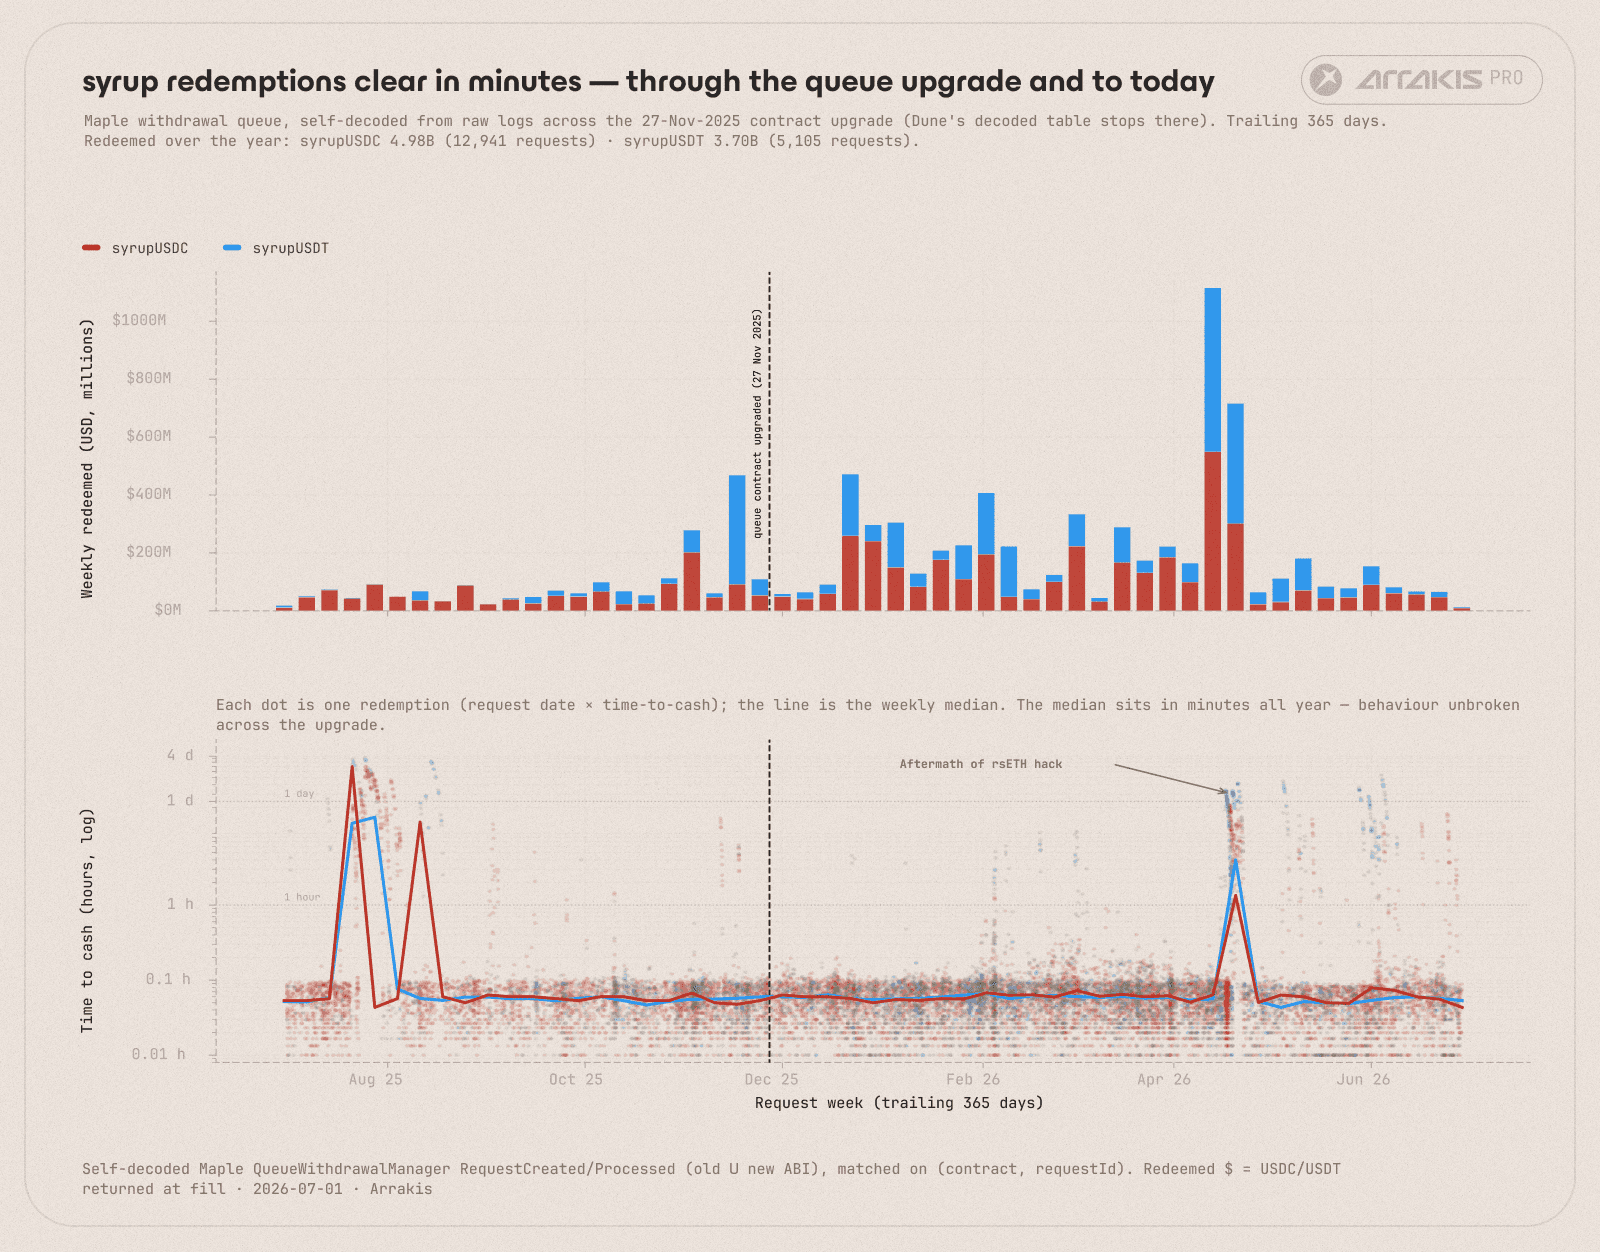
Every syrupUSDC and syrupUSDT redemption of the past year, $8.7B across ~18,000 requests. Top: dollars redeemed each week. Bottom: each dot is one request's time to cash, the weekly median in bold.
Across those requests the median redemption settled in about three and a half minutes for the entire year. Two periods, in late July 2025 and April 2026, marked exceptions, where a wave of redemptions briefly outran the buffer and took hours to a few days to clear.
The April spike was the aftermath of the Kelp DAO rsETH exploit, when unbacked-rsETH liquidations on Aave sent suppliers and borrowers across DeFi rushing to cut exposure. Through that window the primary path's time to cash rose from minutes to hours while the secondary depth held, absorbing the exit flow the buffer could not. The step down at the end of April was a managed trim once conditions had normalised.
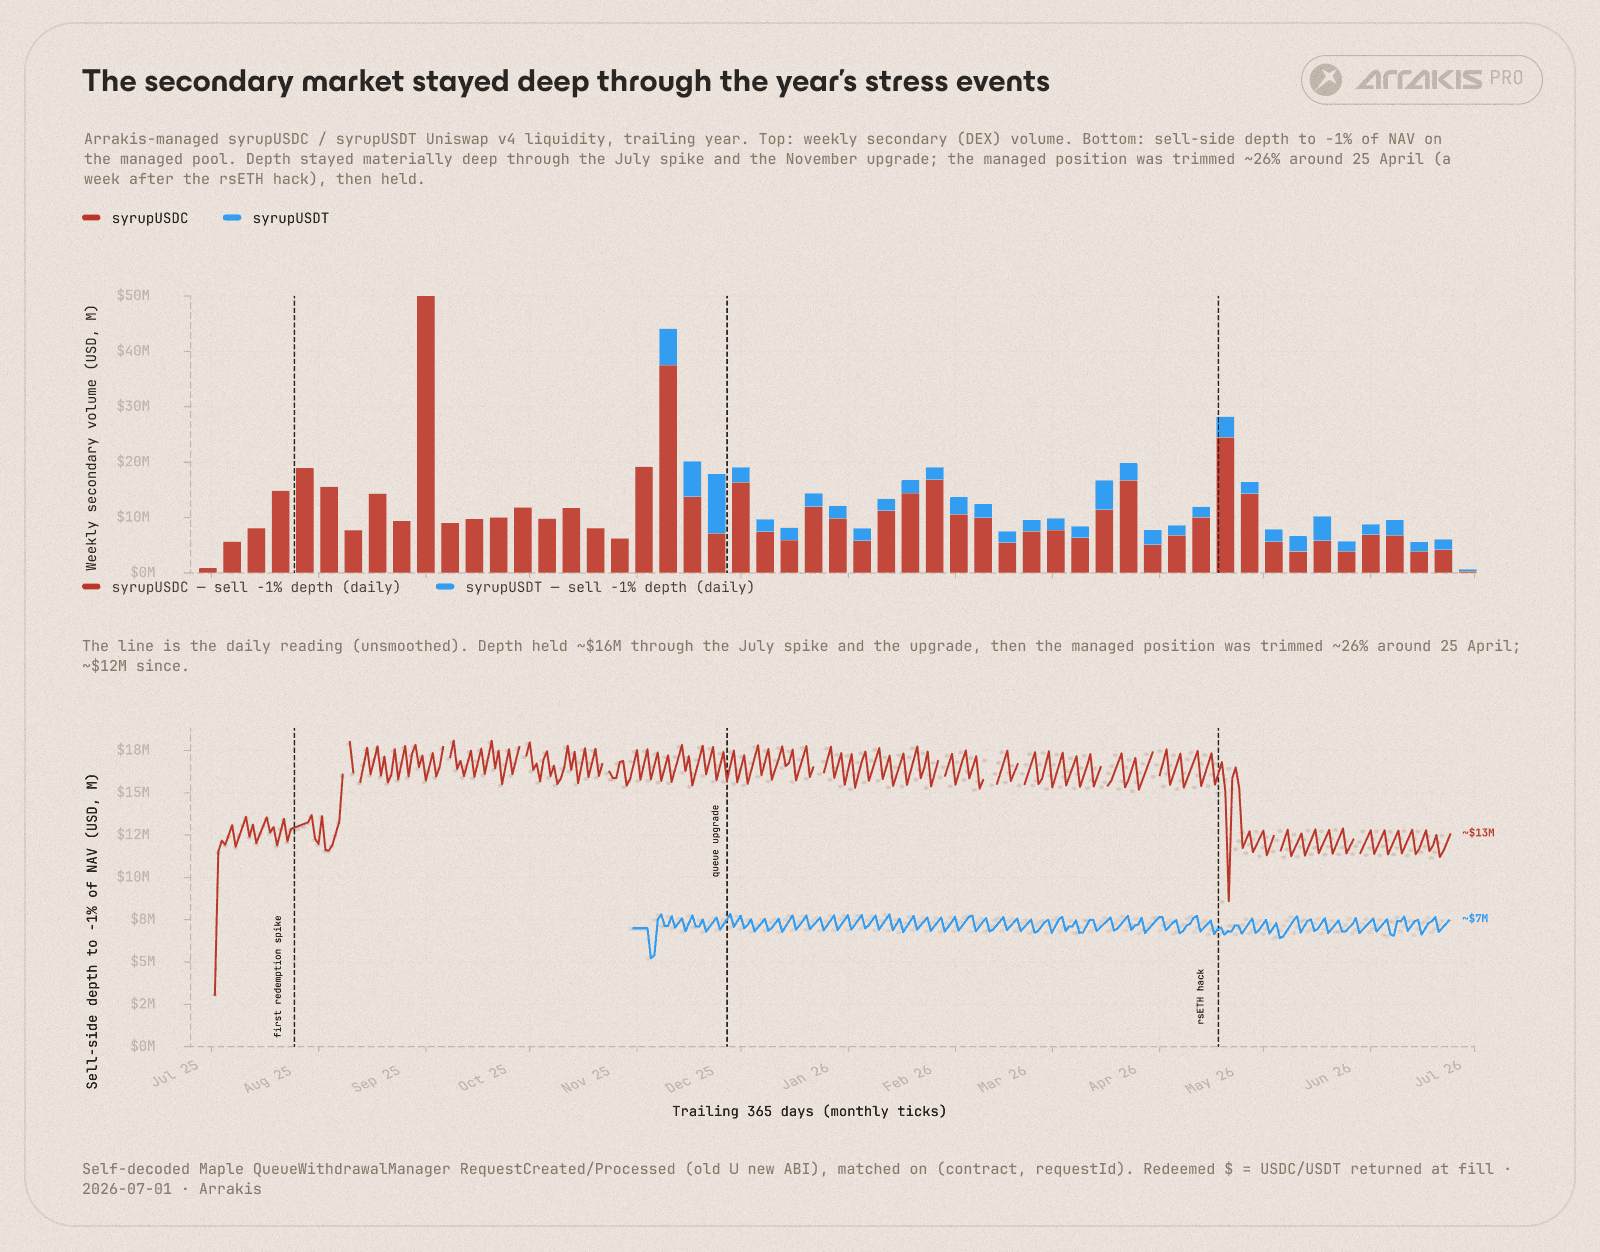
Arrakis-managed Uniswap v4 secondary depth for syrupUSDC and syrupUSDT (sell-side, to −1% of NAV), trailing year. As the primary path's time to cash spiked ~40× in the April stress, syrupUSDC depth fell only ~27% (~$16M to ~$12M), the secondary rail holding while the primary buckled. Top panel: weekly secondary volume.
The playbook, in sequence
For an issuer, the looping playbook runs roughly in this order.
Expose an onchain NAV reference. An oracle, or the asset's own exchange rate. Everything downstream prices off it: the lending market's oracle, the liquidation engine, and the secondary-market pool all read the same reference, so it has to be reliable and resistant to manipulation before anything is built on top.
Get listed with a curator. Bring the NAV reference, the redemption mechanics, and a credible atomic-exit plan, because the plan is what earns the LTV. That LTV is the leverage ceiling, and the ceiling caps how much supply looping can mint, so a deeper exit converts directly into a higher TVL ceiling.
Decide how to provide the atomic exit. An instant primary buffer, a NAV-aligned secondary market, or a mix, and where it sits relative to the lending demand. Where the primary is not atomic, stand up the secondary market on the chain where the loop lives, skewed to the dollar, with Price Convergence holding it at NAV. A buffer pays out at par but sits idle and drags on the advertised yield, while secondary depth earns trading fees and can come from a third party, so most scaled assets run both.
Size the depth. Work back from the largest plausible liquidation and the total stablecoin debt, not from a round number. The pool only has to absorb the looped slice that unwinds at once, not the whole book, so a modest dollar-skewed float backs a large multiple of TVL.
Operate. Rebalance up the yield curve, watch the borrow-to-yield spread that keeps loopers in, and track price-versus-NAV as the early warning. When the spread turns, loopers unwind together, so a widening gap to NAV is the first sign to deepen the market before the unwind cascades.
Conclusion
A NAV-aligned secondary market is core infrastructure for a yield-bearing asset, on the same level as its oracle and its lending markets, and it compounds. Deeper depth draws more lending integrations, more integrations draw more looping, and more looping brings more volume and more reason to deepen the market again. Each turn mints more of the asset and makes the next loop safer, so utility and TVL build on each other rather than waiting on the next allocation push.
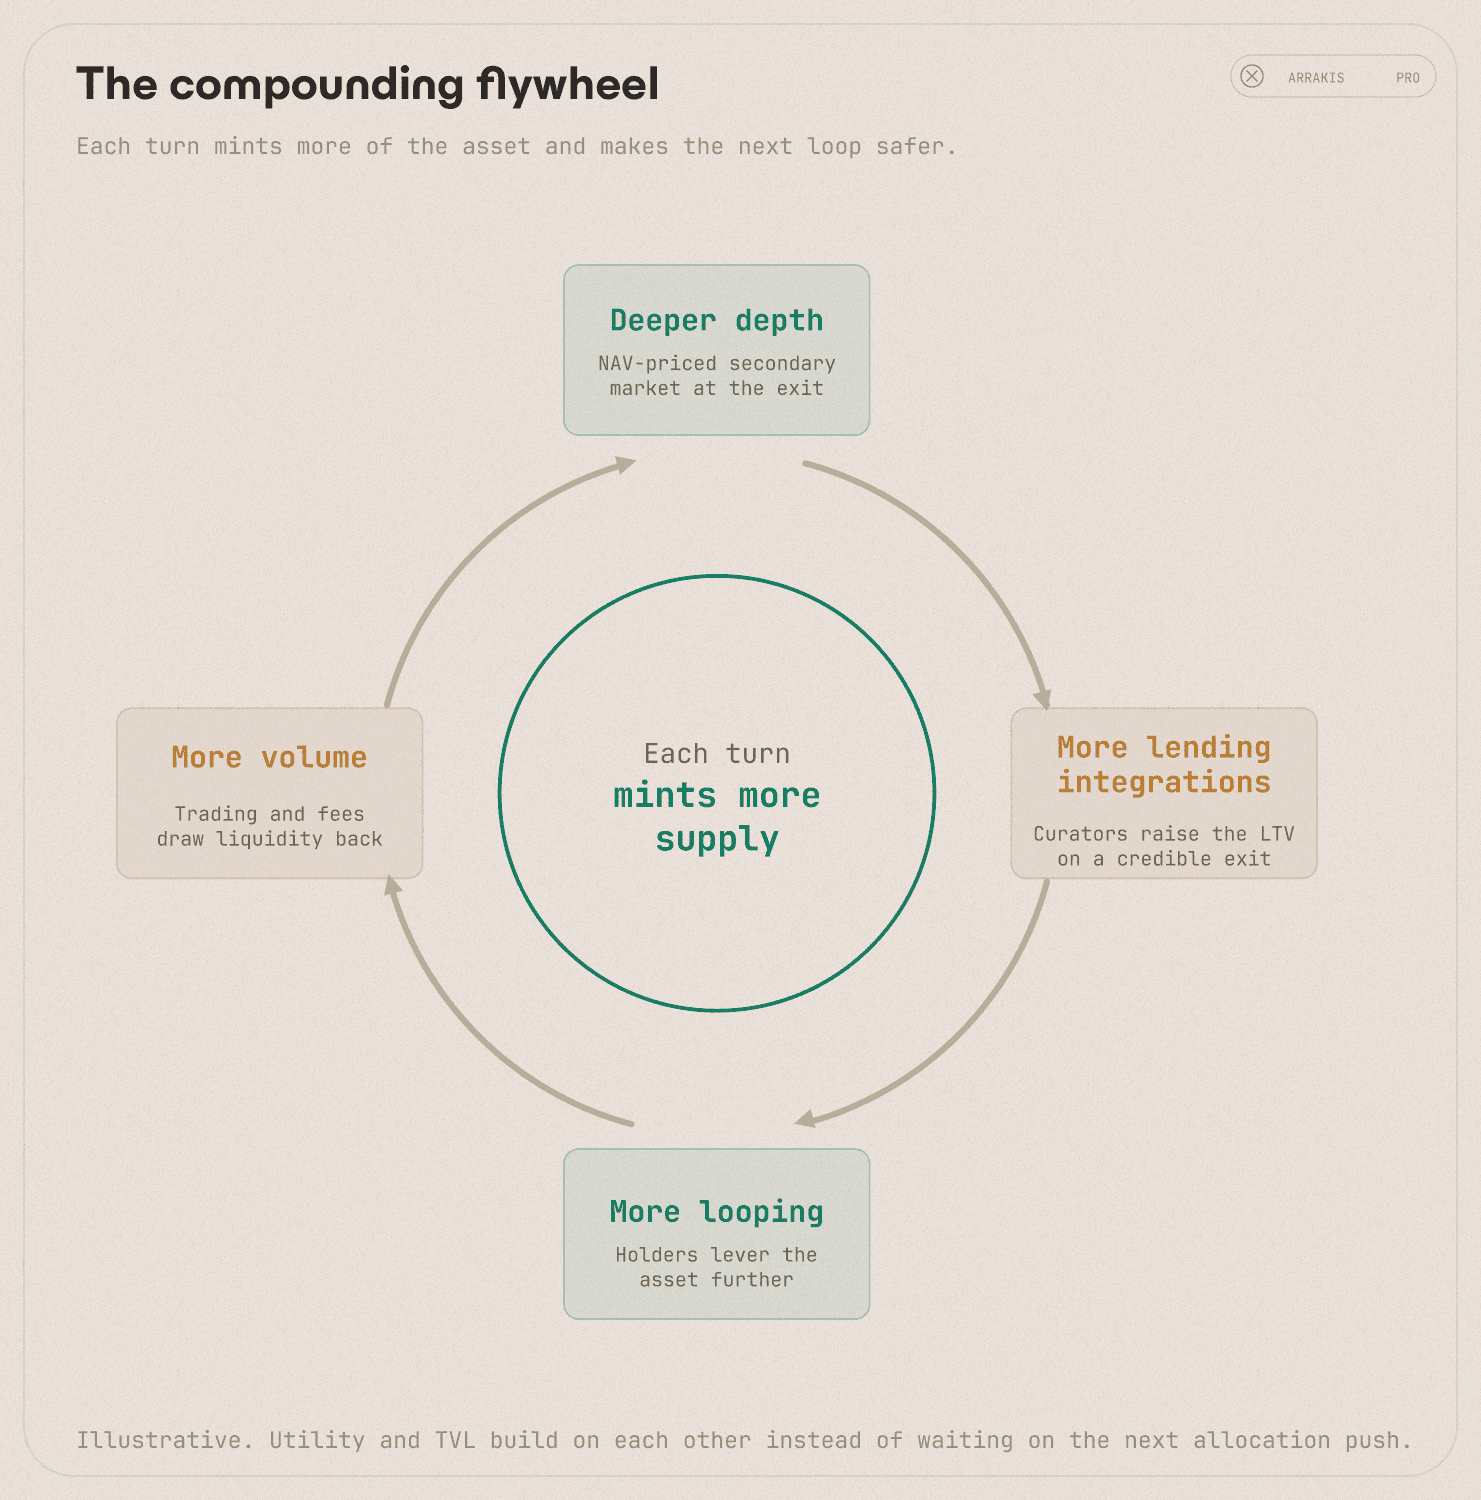
The compounding flywheel: deeper depth, more lending integrations, more looping, more volume, deeper depth. Each turn mints more supply (illustrative).
The same depth is what makes the asset worth holding. A holder gets a position they can lever for extra yield, exit at NAV whenever they want, and post as collateral elsewhere. Growth for the issuer and utility for the holder are the same flywheel seen from two ends.
Two of the three pieces are the issuer's to build. The asset is the issuer's to mint, and the lending listing is a partnership the issuer can pursue. The NAV-aligned secondary market is the specialised piece where Arrakis comes in, either on inventory the issuer commits, or, through Liquidity-as-a-Service, on inventory Arrakis supplies, so the issuer does not tie up treasury capital to bootstrap the market.
This article is for informational and educational purposes only. It is not financial, legal, or investment advice. Figures reflect the sources available at the time of writing and should be independently verified before any decision.